Angular and Radial Axis
in Beta
This section is used for formatting the properties of the Polar axis. Polar axis consists of two axes i.e. Angular axis and Radial axis.
|
|
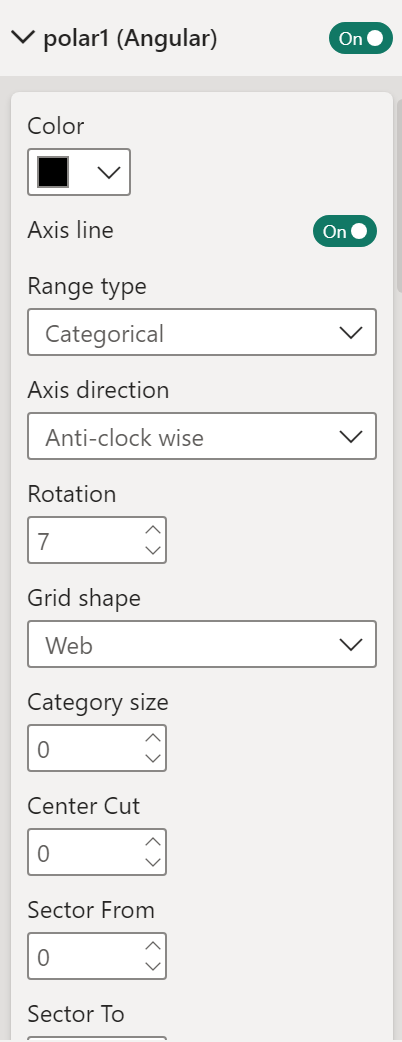
- Angular axis: You can customize angular axis properties. You can set it Off; in case you don’t want to show angular axis details in the visual.
- Color: Allows to change the color of the polar axis.
- Axis line: Show or hide the axis line by toggling the button. The axis labels are intact even if you switch Off Axis line.
- Range type: Choose from Linear or Category. For category axis, you can choose Categorical. For measure axis, you can choose Linear.
- Axis direction: Choose from Clock wise or Anti-clock wise.
- Rotation: Rotates the angular axis with a angle.
- Grid shape: Choose grid shape as Web or Circular.
- Category size: If axis type is categorical, category size can be set.
- Center Cut: Set the center cut.
- Sector From: Set the starting angle of sector.
- Sector To: Set the ending angle of sector.
|
|
|
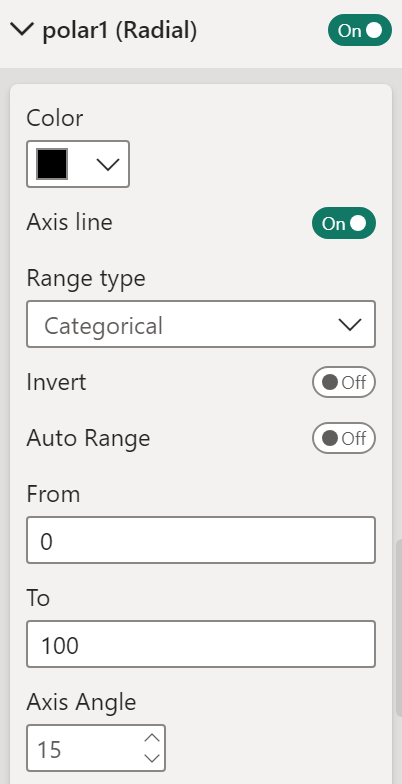
- Radial axis: You can customize radial axis properties. You can set it Off; in case you don’t want to show radial axis details in the visual.
- Color: Allows to change the color of radial axis.
- Axis line: Show or hide the axis line by toggling the button. The axis labels are intact even if you switch Off Axis line.
- Range type: Choose from Linear, Log, Date, Categorical. For category axis, you can choose categorical. For measure axis, you can choose from Linear or Log.
- Invert axis: Invert the axis and the attached plot.
- Auto range: Switching it ‘Off, allows to define the axis range manually.
- Axis angle: Set the radial axis angle.
|
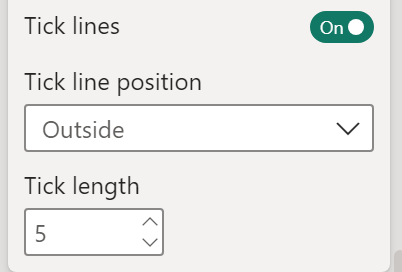
Properties available under Axis section related to Axis Tick marks.
|
|
- Tick lines: Enable or disable the tick marks on the axis by toggling the On/Off button.
Change the Tick line position. Choose Inside to draw the tick marks towards the chart and Outside to draw the marks outward.
- Change the tick length according to the need. The value ranges from 1 to 20.
|
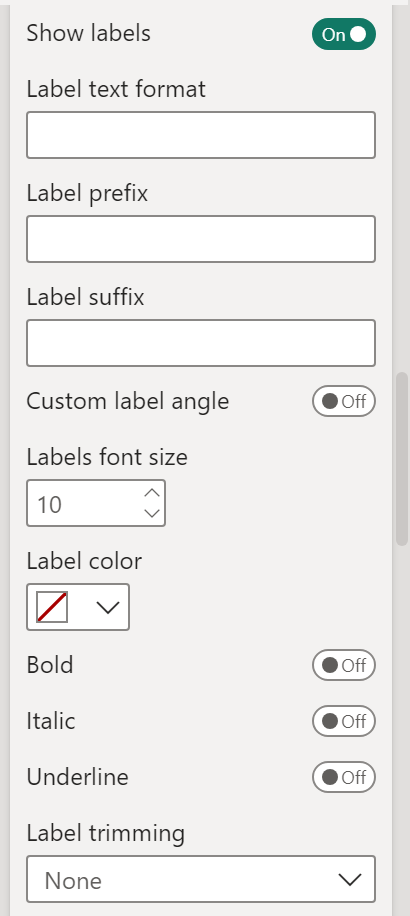
Properties available under Axis section related to Axis labels.
|
|
Labels: Change the axis labels’ font, size, style (Bold, Italic and/or Underline), color, angle and label trimming.
Axis labels can be removed from the visual by disabling ‘Show labels’.
- Label text format: Format the axis labels using D3 format. Say, labels need to be changed to k or M format, this field can be used for formatting purpose.
- Label prefix: Text written here will be added before the axis labels.
- Label suffix: Text here will be added after the axis labels.
- Custom label angle: Labels can be set at custom angle.
- Labels font size: Labels font size can be set.
- Label trimming: Trims the size of axes labels displayed. Max label length sets the limit of axes label length. The labels can be trimmed in the following ways:
- Truncate start: Truncates start of axes label.
- Truncate end: Truncates end of axes label.
- Ellipses in start: It puts an ellipsis (...) at the start of label and trims the label from the beginning.
- Ellipses in middle: It puts an ellipsis (...) in the middle of label and trims the label from the beginning and end.
- Ellipses in end: It puts an ellipsis (...) at the end of label and trims the label from the end.
- Break into 2 lines: It breaks the label into two lines if label exceeds the max label length but it does not truncates the axes label text.
- Multi-line: It breaks the label into multiple lines if label exceeds the max label length but it does not truncates the axes label text.
|
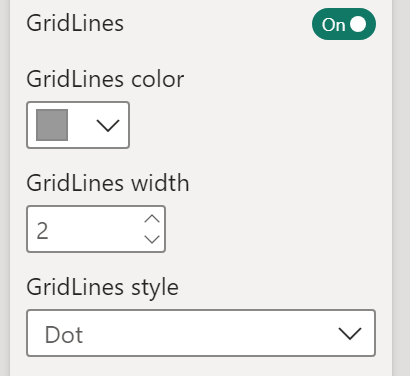
Properties available under Axis section related to Axis grid lines.
|
|
- GridLines: Enable or disable grid lines in the chart as per requirement.
- GridLines color: Allows to change the color of the grid lines.
- GridLines width: Allows to change the width of the grid lines.
- GridLines style: Allows to change the style of the grid lines.
|