Impact on UI due to changes in Histogram v6.0.0.0
Published On: 2025-02-24We have enhanced default values of some properties of Histogram in v6.0.0.0. Due to this upgrade to the latest version may introduce some changes in default look and feel of the chart.
Please follow steps listed below in each section to restore old look and feel:
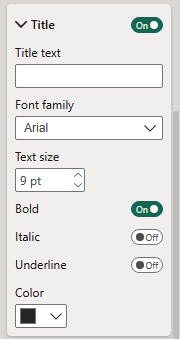
- X/Y axis: Title font size is increased by 2 points and is also bold by default.
- Under Format visual -> X/Y axis -> Title
- Decrement the Text size by 2 points
- Turn off Bold option
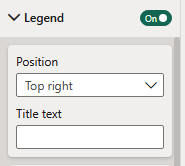
- Legend is now off by default.
- Under Format visual -> Legend
- Turn on Legend toggle
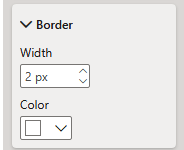
- Histogram bar border width is 2px and color is white by default.
- Under Format visual -> Value -> Histogram -> Border
- Set Width to 0
- Set Color to No Fill
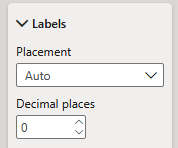
- Histogram bar label text precision is now 0 by default.
- Under Format visual -> Value -> Histogram -> Labels
- Set Decimal places to 2
← blogs