This visual is deprecated in the favour of Dual X-Axis Combo Chart visual. To migrate, please check tutorial.
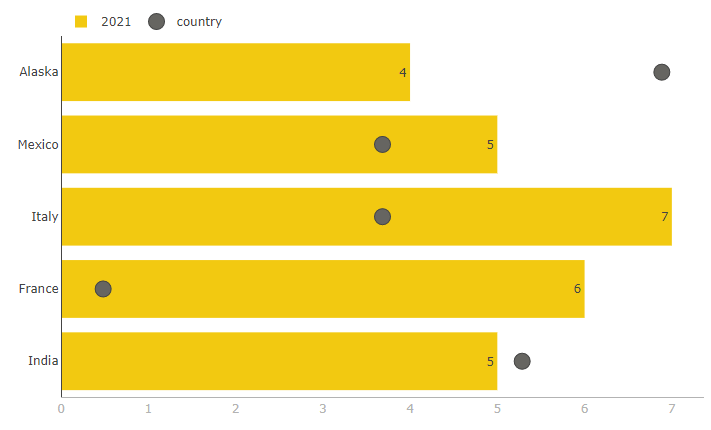
Bar and Dot Chart

Bar and Dot Combo chart is great for comparing categorical data through bars and the trend. We can also use the dots as target value in the same graph for comparative analysis.
Get new offering
This visual is deprecated in favor of more advanced visual. Click the button to go to that offering.
← Gallery
Designers
© Monnel Canada Inc.