This visual is deprecated in the favour of Dual Y-Axis Combo Chart visual. To migrate, please check tutorial.
Dual Lines with Column Chart

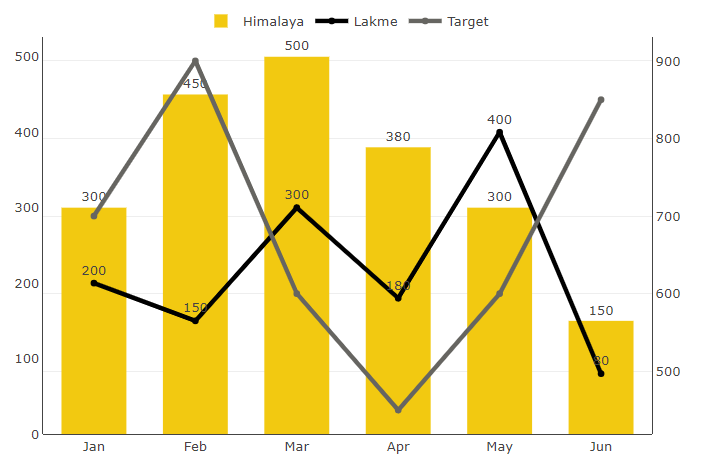
Dual Lines with Column Chart is a combo chart that shows the relationship between two variables. Dual lines on Y axis help to show the actual and target value. You can also use this visual to show two lines with values of different magnitudes.
Get new offering
This visual is deprecated in favor of more advanced visual. Click the button to go to that offering.
← Gallery
Designers
© Monnel Canada Inc.