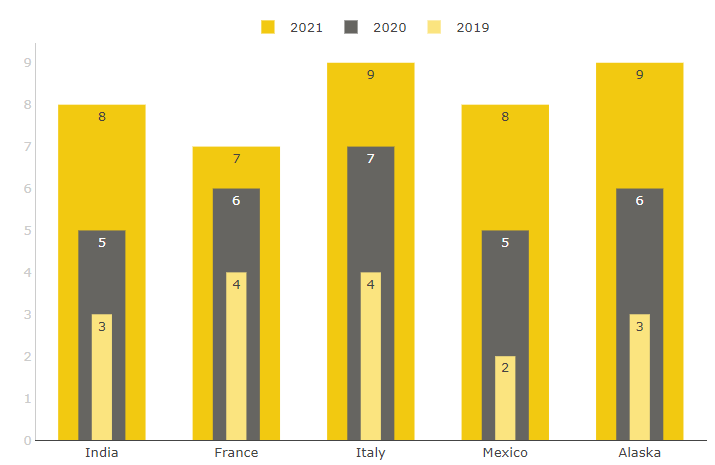
Nested Column Chart

Nested Column Chart compares three values simultaneously with inner, middle and outer bars. This visual is best for comparing two years of data with the target.
Get new offering
This visual is deprecated in favor of more advanced visual. Click the button to go to that offering.
← Gallery
Designers
© Monnel Canada Inc.