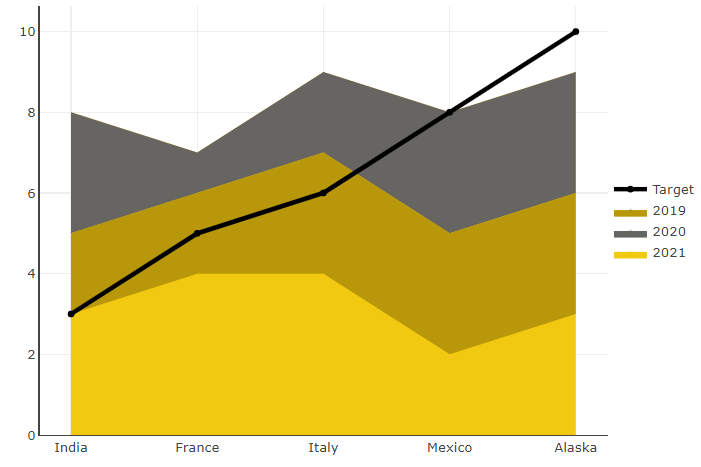
Stacked Area and Line Combo Chart

In this Power BI custom visual, the stacked area chart allows you to see how a variable changes along with its total, and line can represent a different variable, such as target.
Get new offering
This visual is deprecated in favor of more advanced visual. Click the button to go to that offering.
← Gallery
Designers
© Monnel Canada Inc.