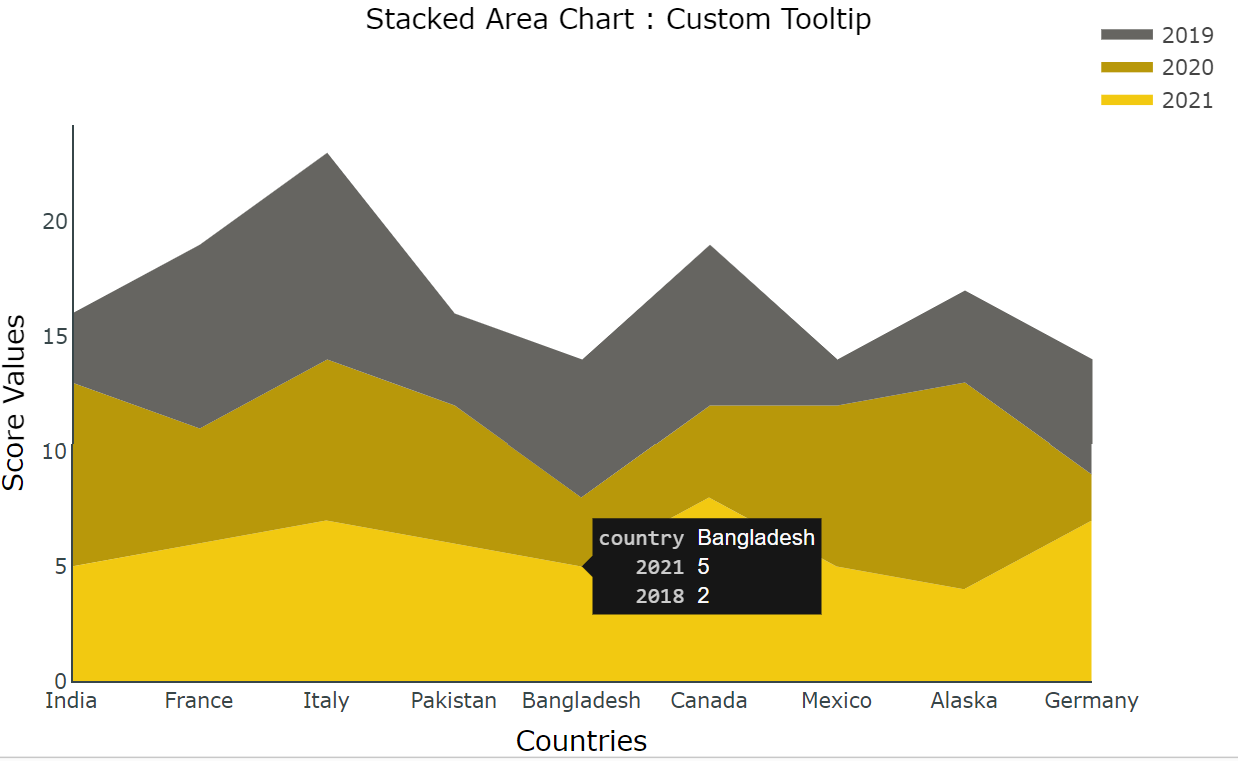
Stacked Area Chart with Custom Tooltip
Stacked Area Chart with Custom Tooltip has a custom tooltip feature which can show each stack value separately. This chart is great for composition analysis, to visualise what value is composed of and the volume of its components.
Get new offering
This visual is deprecated in favor of more advanced visual. Click the button to go to that offering.
← Gallery
Designers
© Monnel Canada Inc.