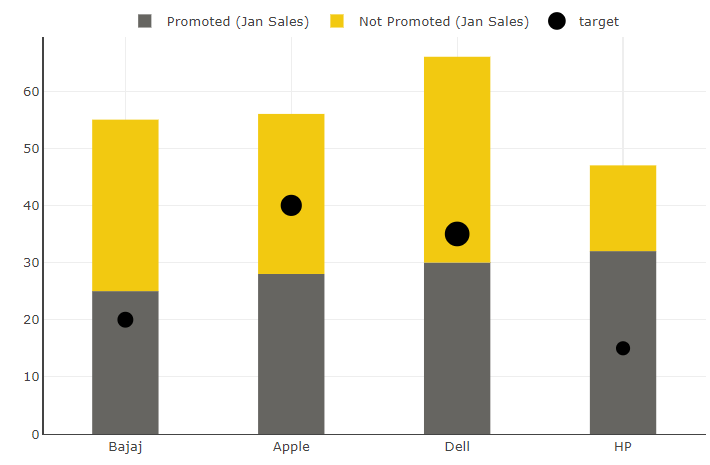
Stacked Column and Scatter Chart

This Power BI custom visual is a combo chart created by the combination of stacked columns and scatter chart. Stacked columns are used to show the parts of multiple totals and scatter plot is used to show the relationship between items based on two different variables.
Get new offering
This visual is deprecated in favor of more advanced visual. Click the button to go to that offering.
← Gallery
Designers
© Monnel Canada Inc.