Get the visualizations that matter to you

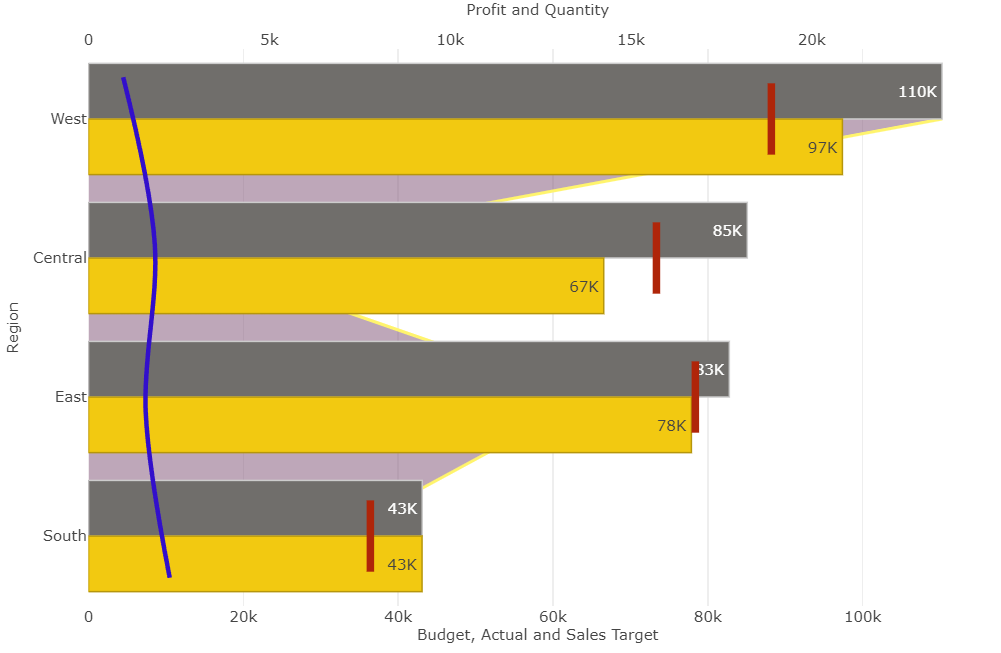
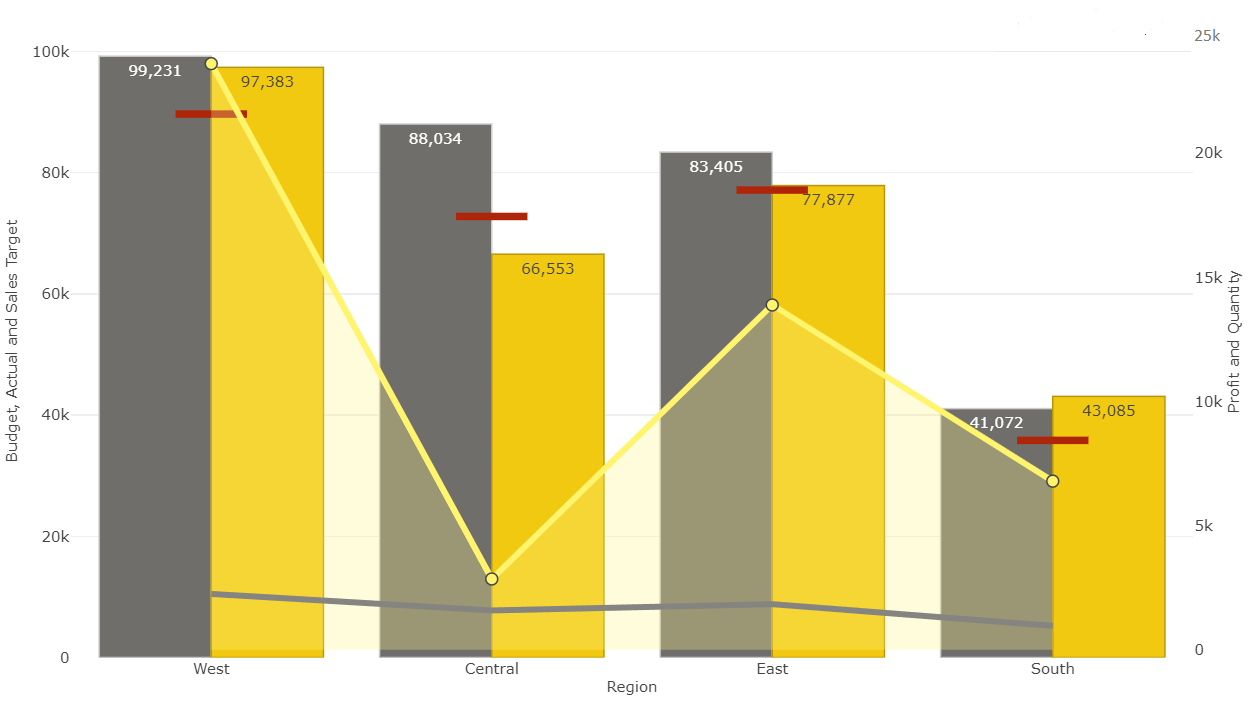
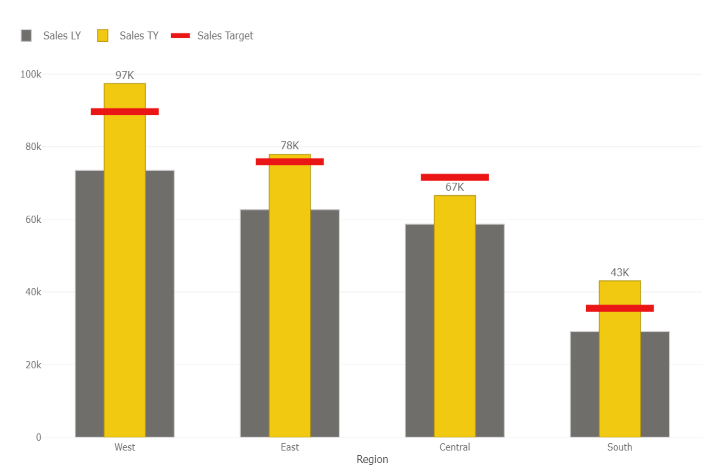
Replicate Excel/BI charts
Make Power BI reports consistent with your previous Excel/BI reports using custom visuals from our gallery
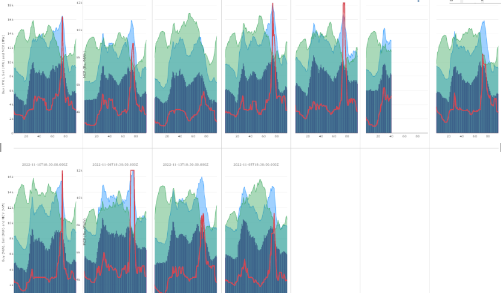
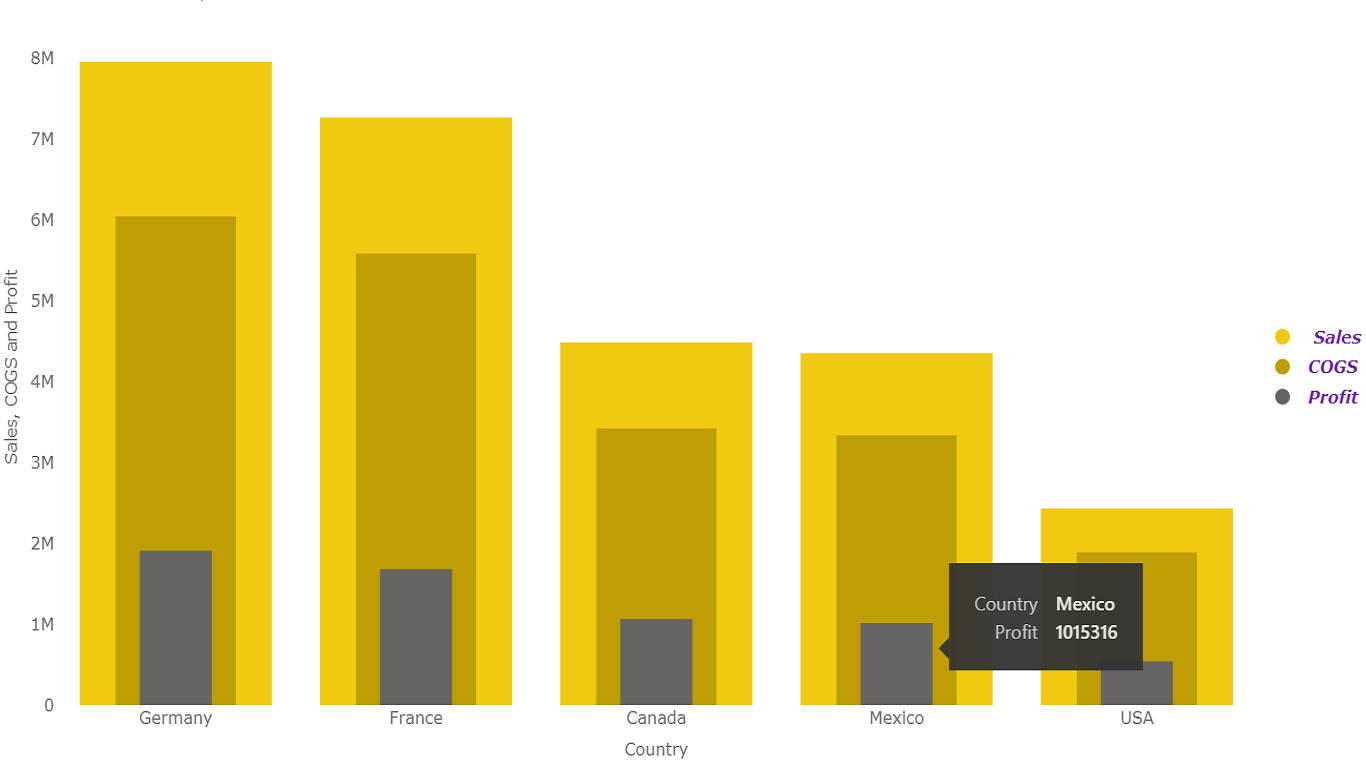
Add intuitive visual
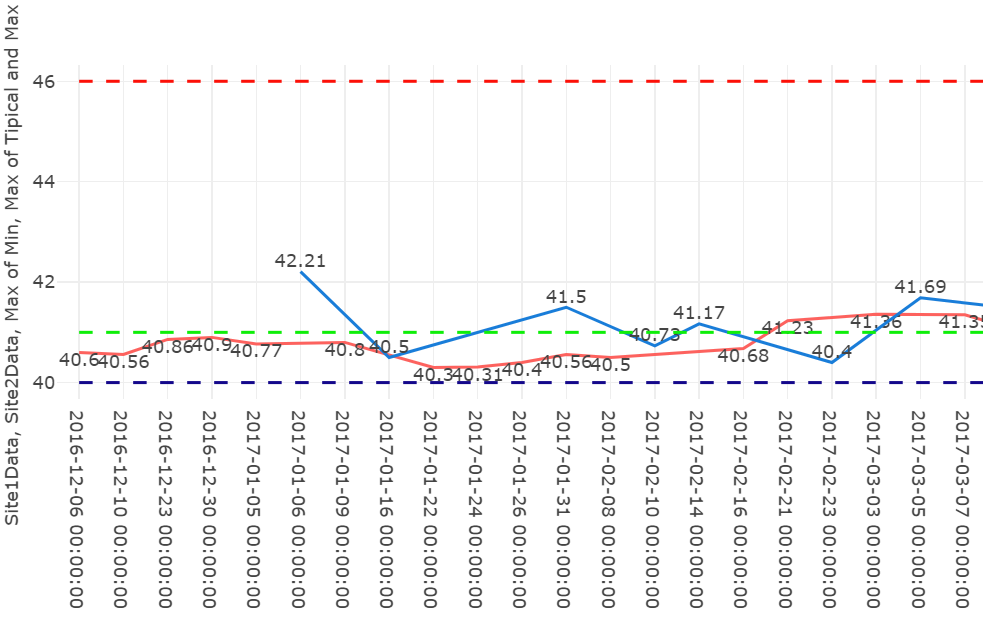
Use specialized visuals to clearly show insights in your reports with our advanced charts
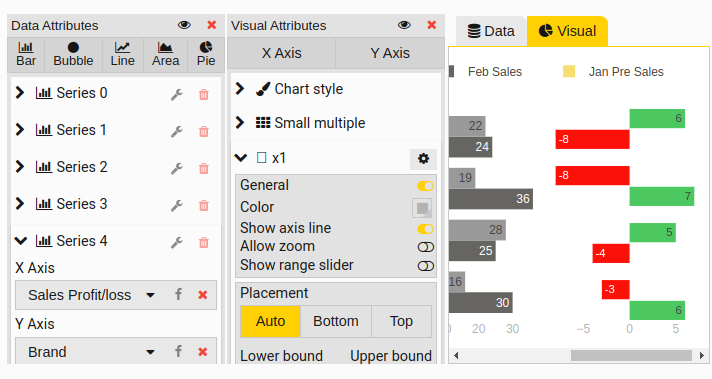
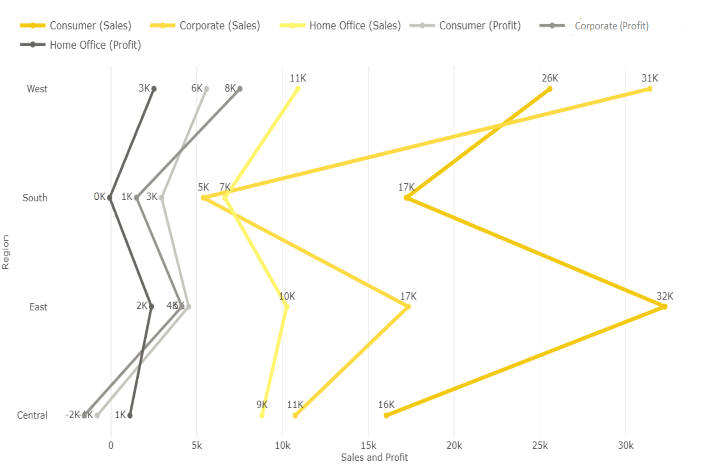
Use visuals customized to your need
Improve analytics in your Power BI report with visuals customized for your own special case
Explore PBIVizEdit to find the right Power BI Custom Visuals
With PBIVizEdit, you can get relevant custom visuals for your Power BI reports. Get pre-existing custom visuals or create your own. Try free for 30 days in all Power BI platforms. Plus, we’ll help you in case you want to create advanced Power BI visuals.
Learn how PBIVizEdit works ⇾Power BI Custom Visuals Gallery

Our Trusted Customers
Build better reports
with PBIVizEdit custom visuals
with PBIVizEdit custom visuals
Or Submit visual details for setting up your Power BI custom visual
Have queries, contact us.