Introduction
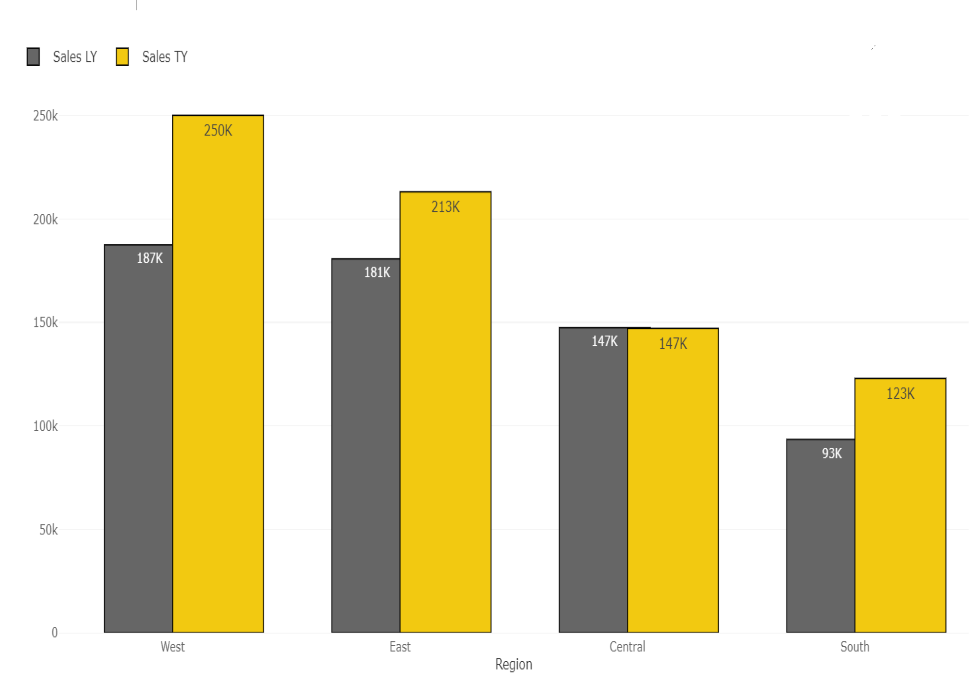
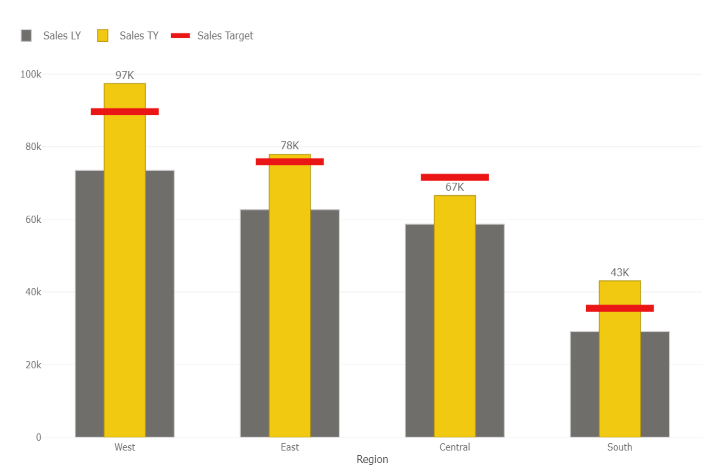
Lipstick Column (Pro) visual gives you quicker, better and attractive visualization where you can compare 2 or 3 values for a category. For example, planned vs. actual expenses, current vs. previous year sales, estimated vs actual revenue or target vs actual achievements.
It shows major trend on the foreground and the minor trend behind the major for a precise comparison of both values.
Usecases
Some of the business cases where Lipstick Column (Pro) can be used are:
- actual vs. target sales per salesperson/division/product.
- budget vs. expense per project.
Variations
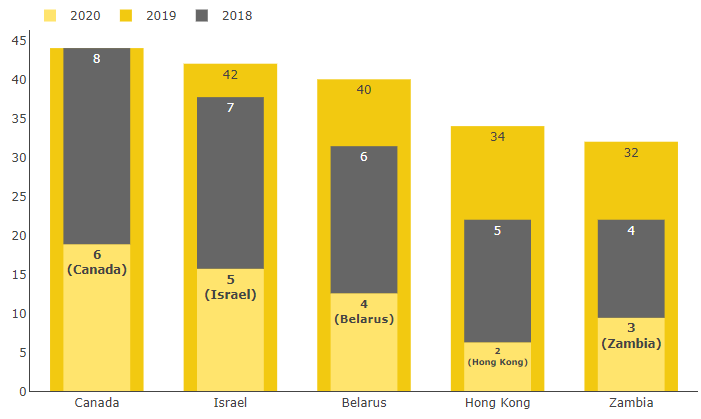
Using Lipstick Column (Pro) visual you can create, variations of overlay columns. For example:
- thermometer column chart
- column overlap chart
- column chart with patterns
Feature available
- column offset, width, color and transparency
- finer formatting for patterns
- custom label formatting
- general Power BI formatting available
- supports tooltip page
- supports drill down
- supports bookmarks
If you have queries, please contact us.