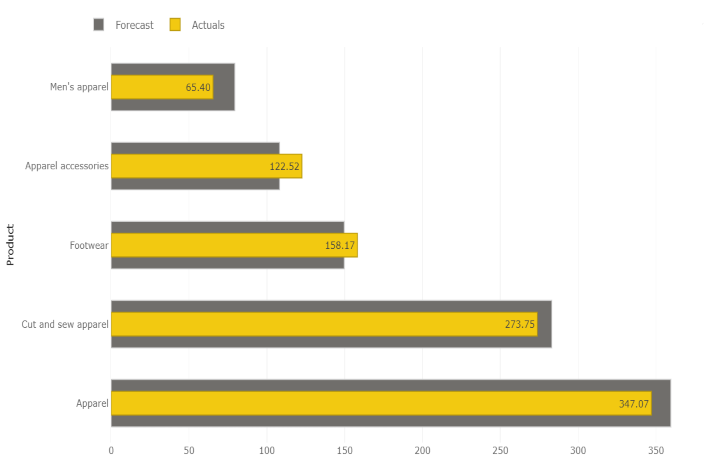
Lipstick Bar chart shows the primary value per category on the foreground and the secondary value behind the primary for a precise comparison of both values. Since both values are placed on top of each other it also becomes a more compact alternative to show both values per category.
Note - This visual is a part of our standard suite.