This visual is deprecated in the favour of Advanced Line Chart visual. To migrate, please check tutorial.
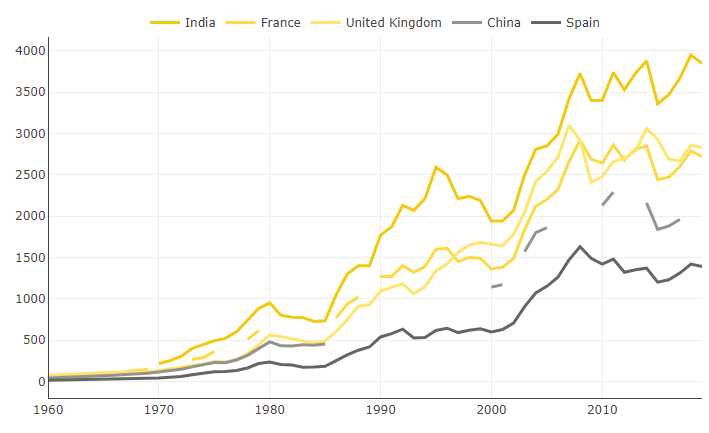
Non Continuous Line Chart

The visual is great and helpful for users who need non-continuous lines where the data is not available. It is best for comparing sales data or any trend for multiple years/fields.
Get new offering
This visual is deprecated in favor of more advanced visual. Click the button to go to that offering.
← Gallery
Designers
© Monnel Canada Inc.