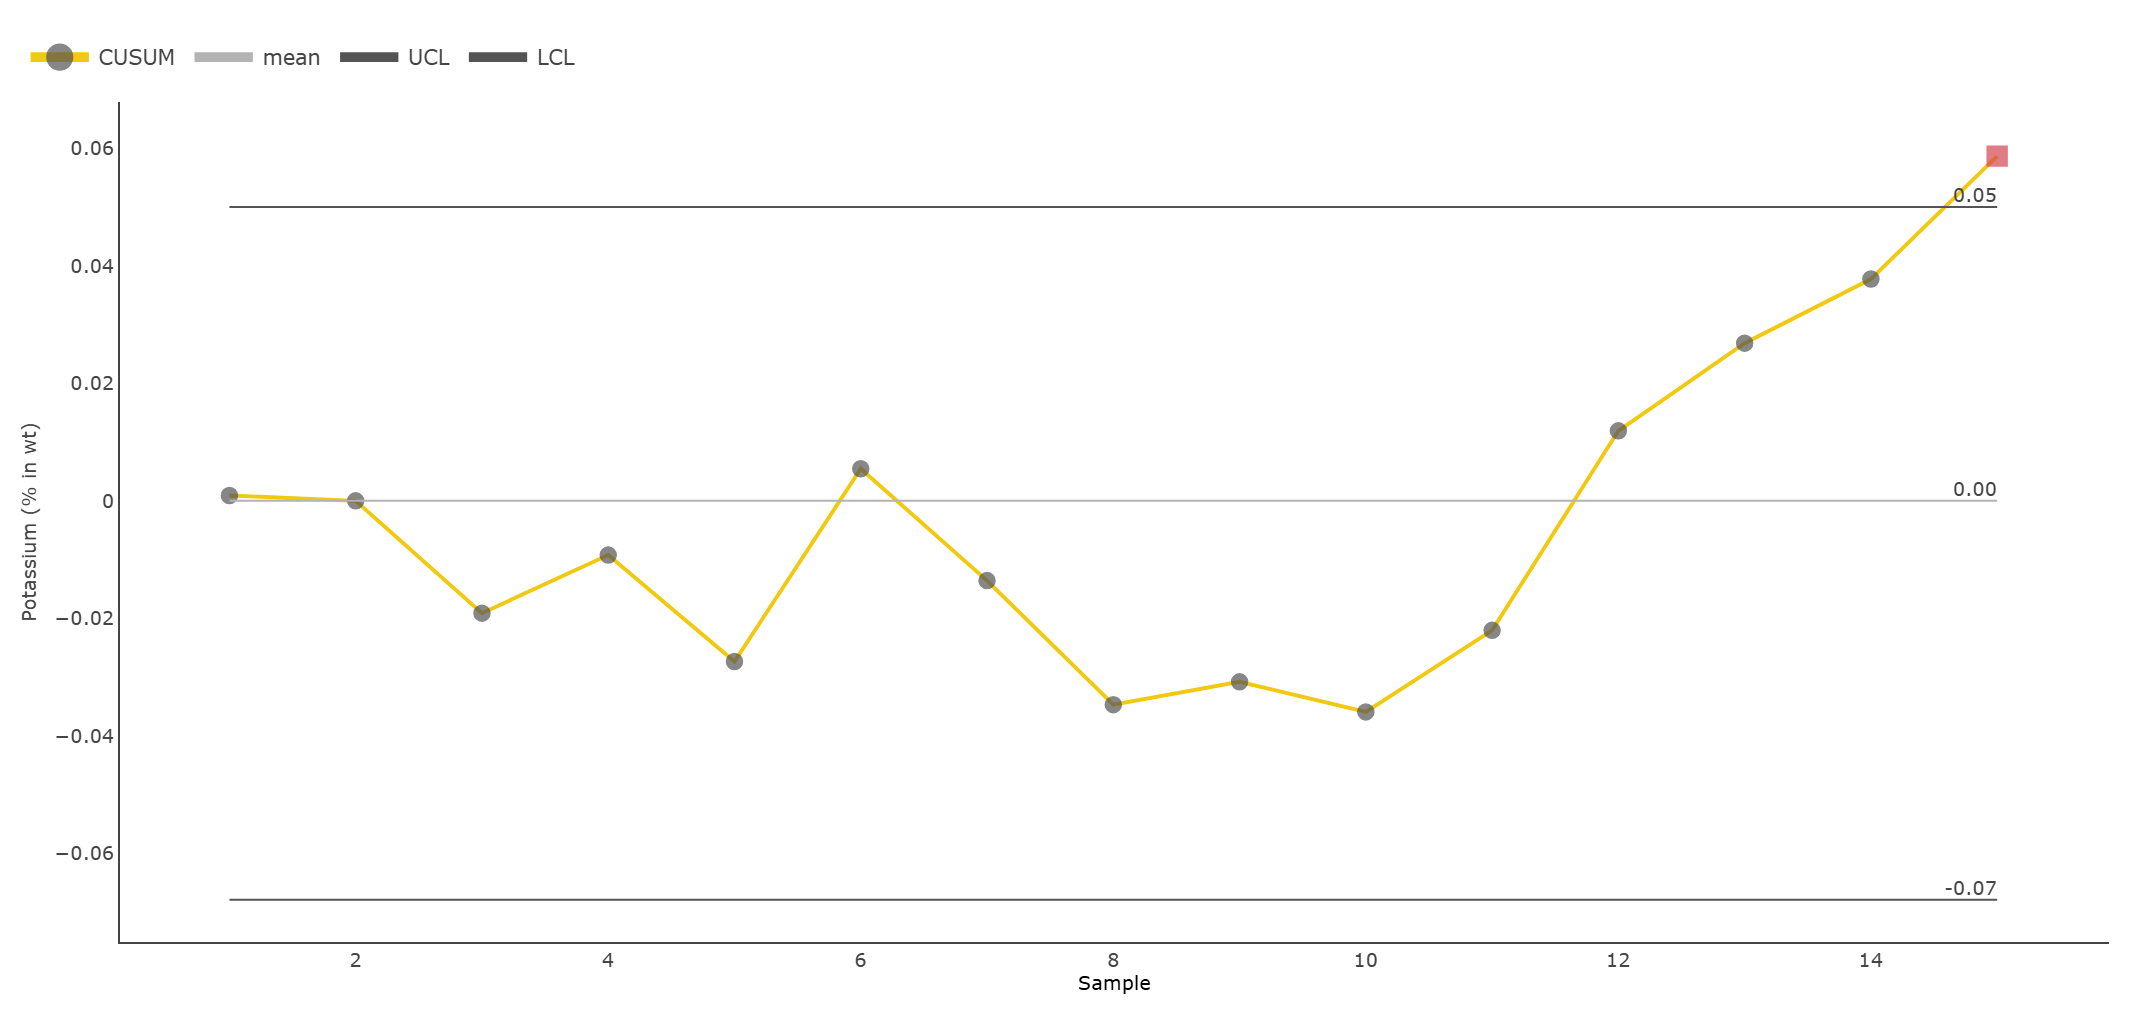
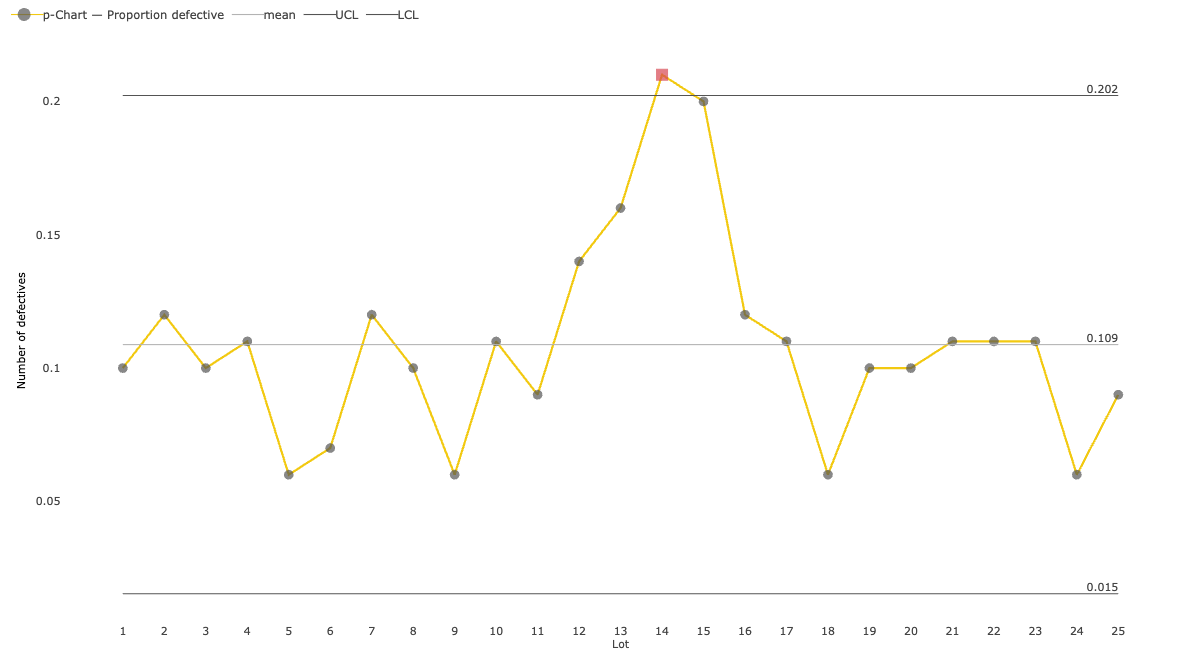
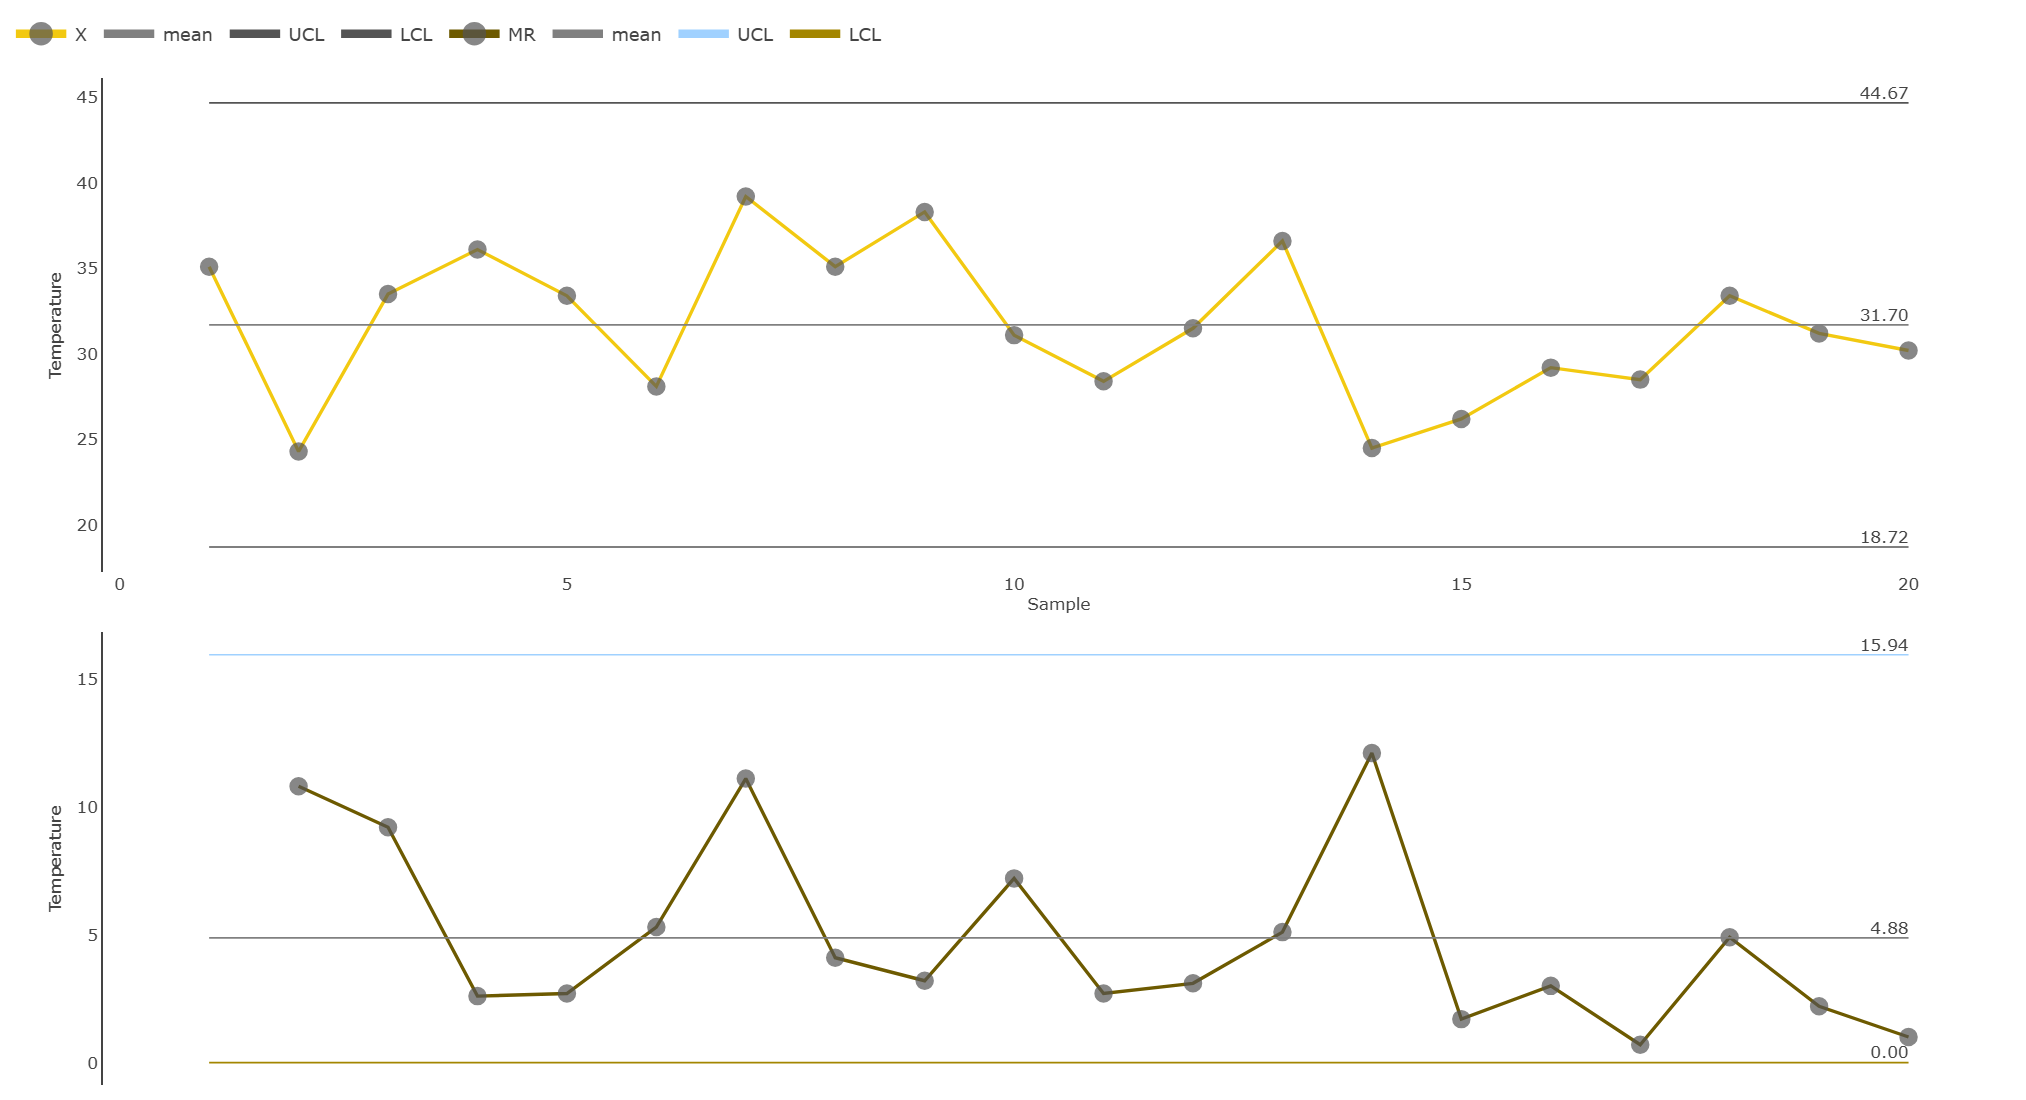
This Power BI custom visual is used to monitor and control quality by detecting small, sustained process shifts that traditional Shewhart charts may miss. It supports time-weighted chart types including CUSUM, Moving Average (MA), and EWMA, making it ideal for early detection of process drift and enabling quick, data-driven quality improvement decisions.