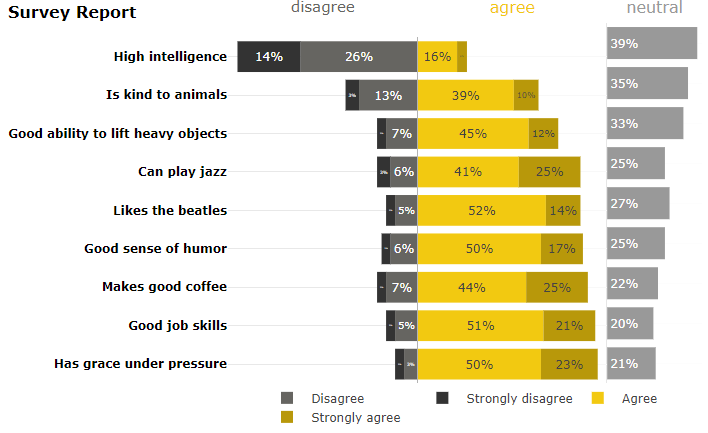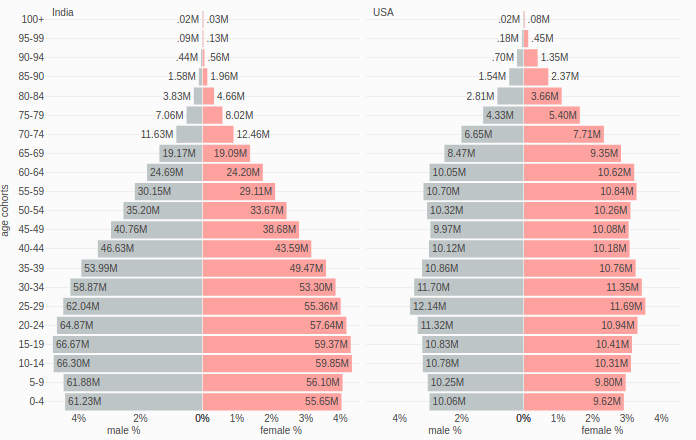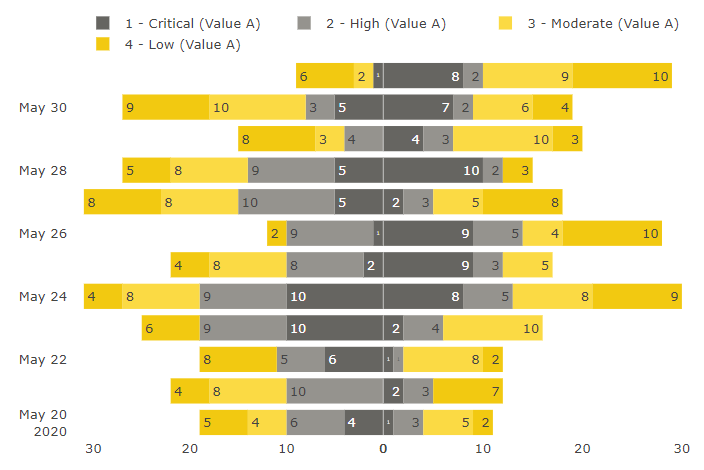
Tornado charts, are a special type of Bar chart, where the data categories are listed vertically instead of the standard horizontal presentation.
Tornado charts, are a special type of Bar chart, where the data categories are listed vertically instead of the standard horizontal presentation.