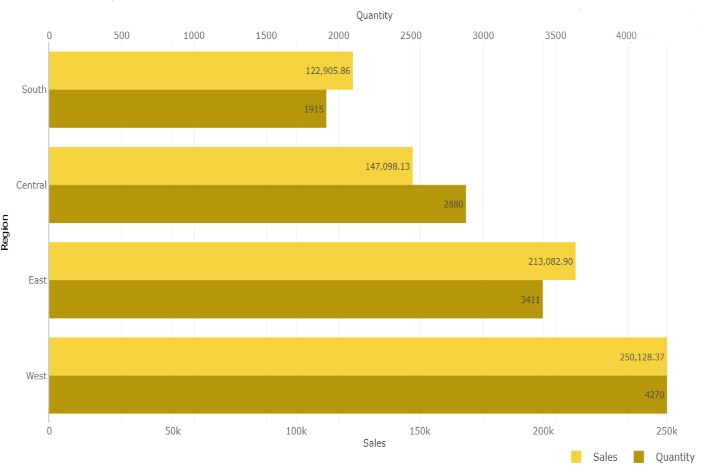
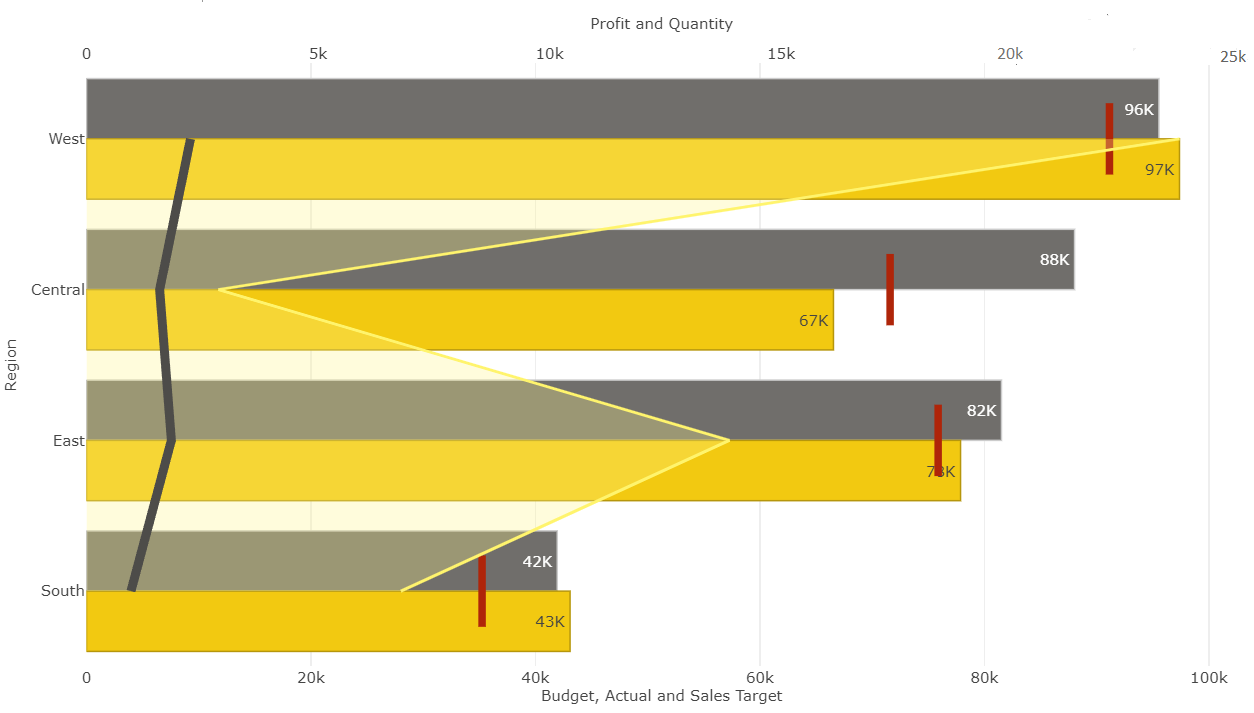
Dual X-Axis Bar Chart is a great way to easily illustrate the relationship between two different variables. They illustrate a lot of information with limited space and allow you to discover trends you may have otherwise missed if you're switching between graphs.
Note - This visual is a part of our standard suite.