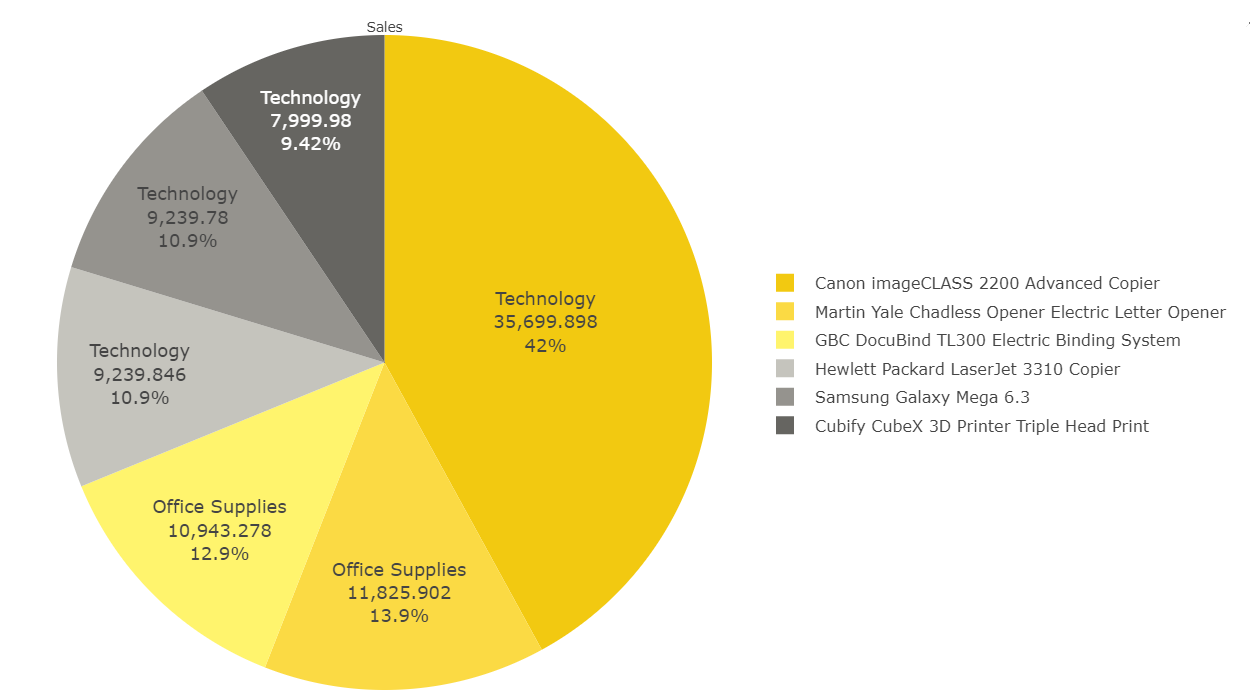
Advanced Donut and Pie Chart, previously known as Pie Chart with Full Legend Label, is a Power BI custom visual where you can show all the legends in word wrapped format. This chart is great for composition analysis, to visualise the magnitude of value.
Note - This visual is a part of our standard suite.