Histogram Chart

This visual can display histogram charts (grouped or stacked)
Note - This visual is a part of our standard suite.
Get Sample
Download sample .pbix report
  Get Trial  
Download visual and get trial license
  Buy Now  
Purchase license
Visual Image

UI changes in v6.0.0.0: How to restore?

  • X/Y axis: Title font size is increased by 2 points and is now bold by default.
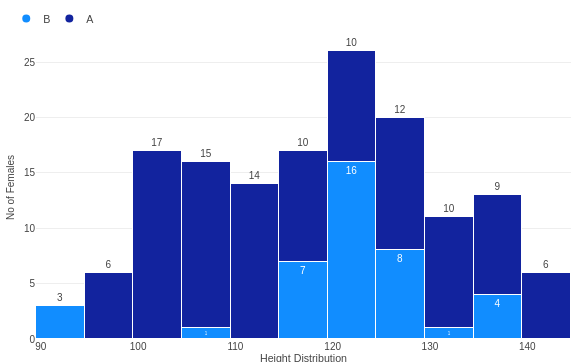
  • Legend is now off by default.
  • Histogram: Border Width is now 2px and Color is white by default.
  • Histogram: Text precision is now 0 by default.

Explore this visual in Live Power BI report

Tutorial


← Gallery