


- Merged Bar Chart has been renamed to Side By Side Bar Chart
- Side By Side Clustered Bar Chart's and Side By Side Bar Chart's functionalities have been merged into this chart.
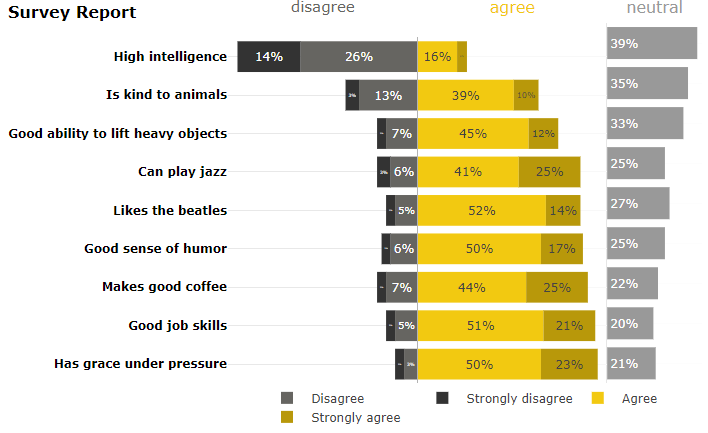
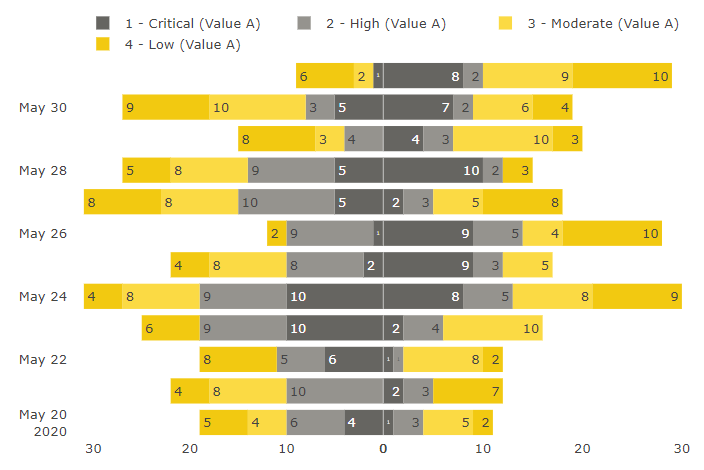
Side By Side Bar Chart
Explore this visual in Live Power BI report
Similar visuals
← Gallery