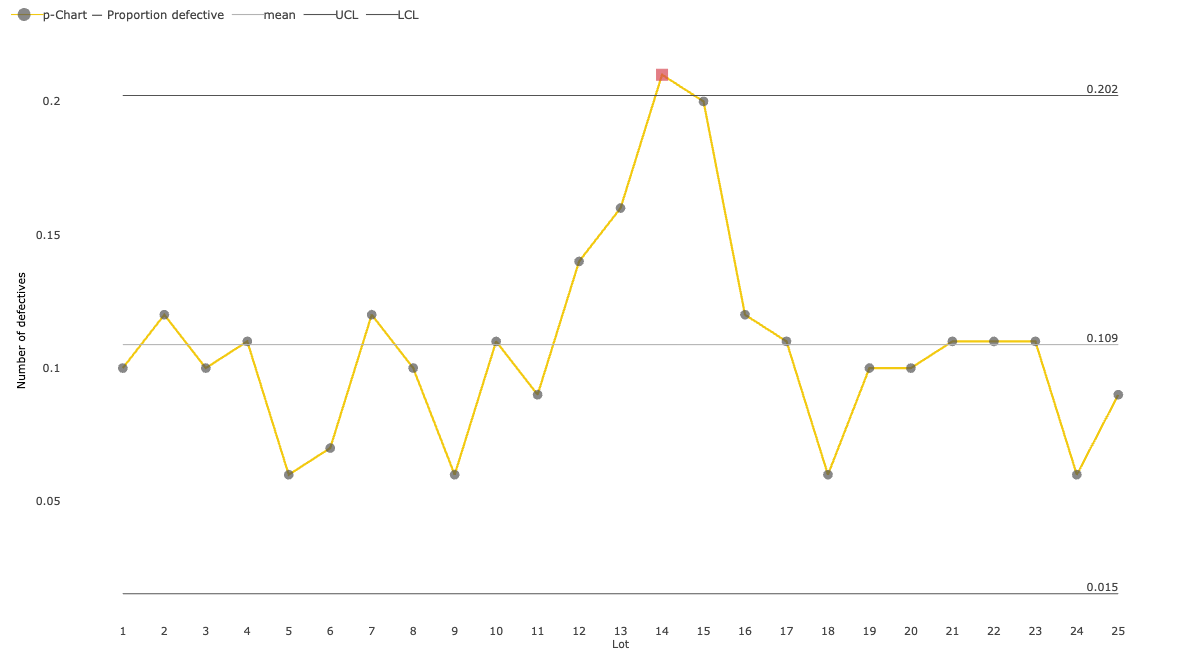
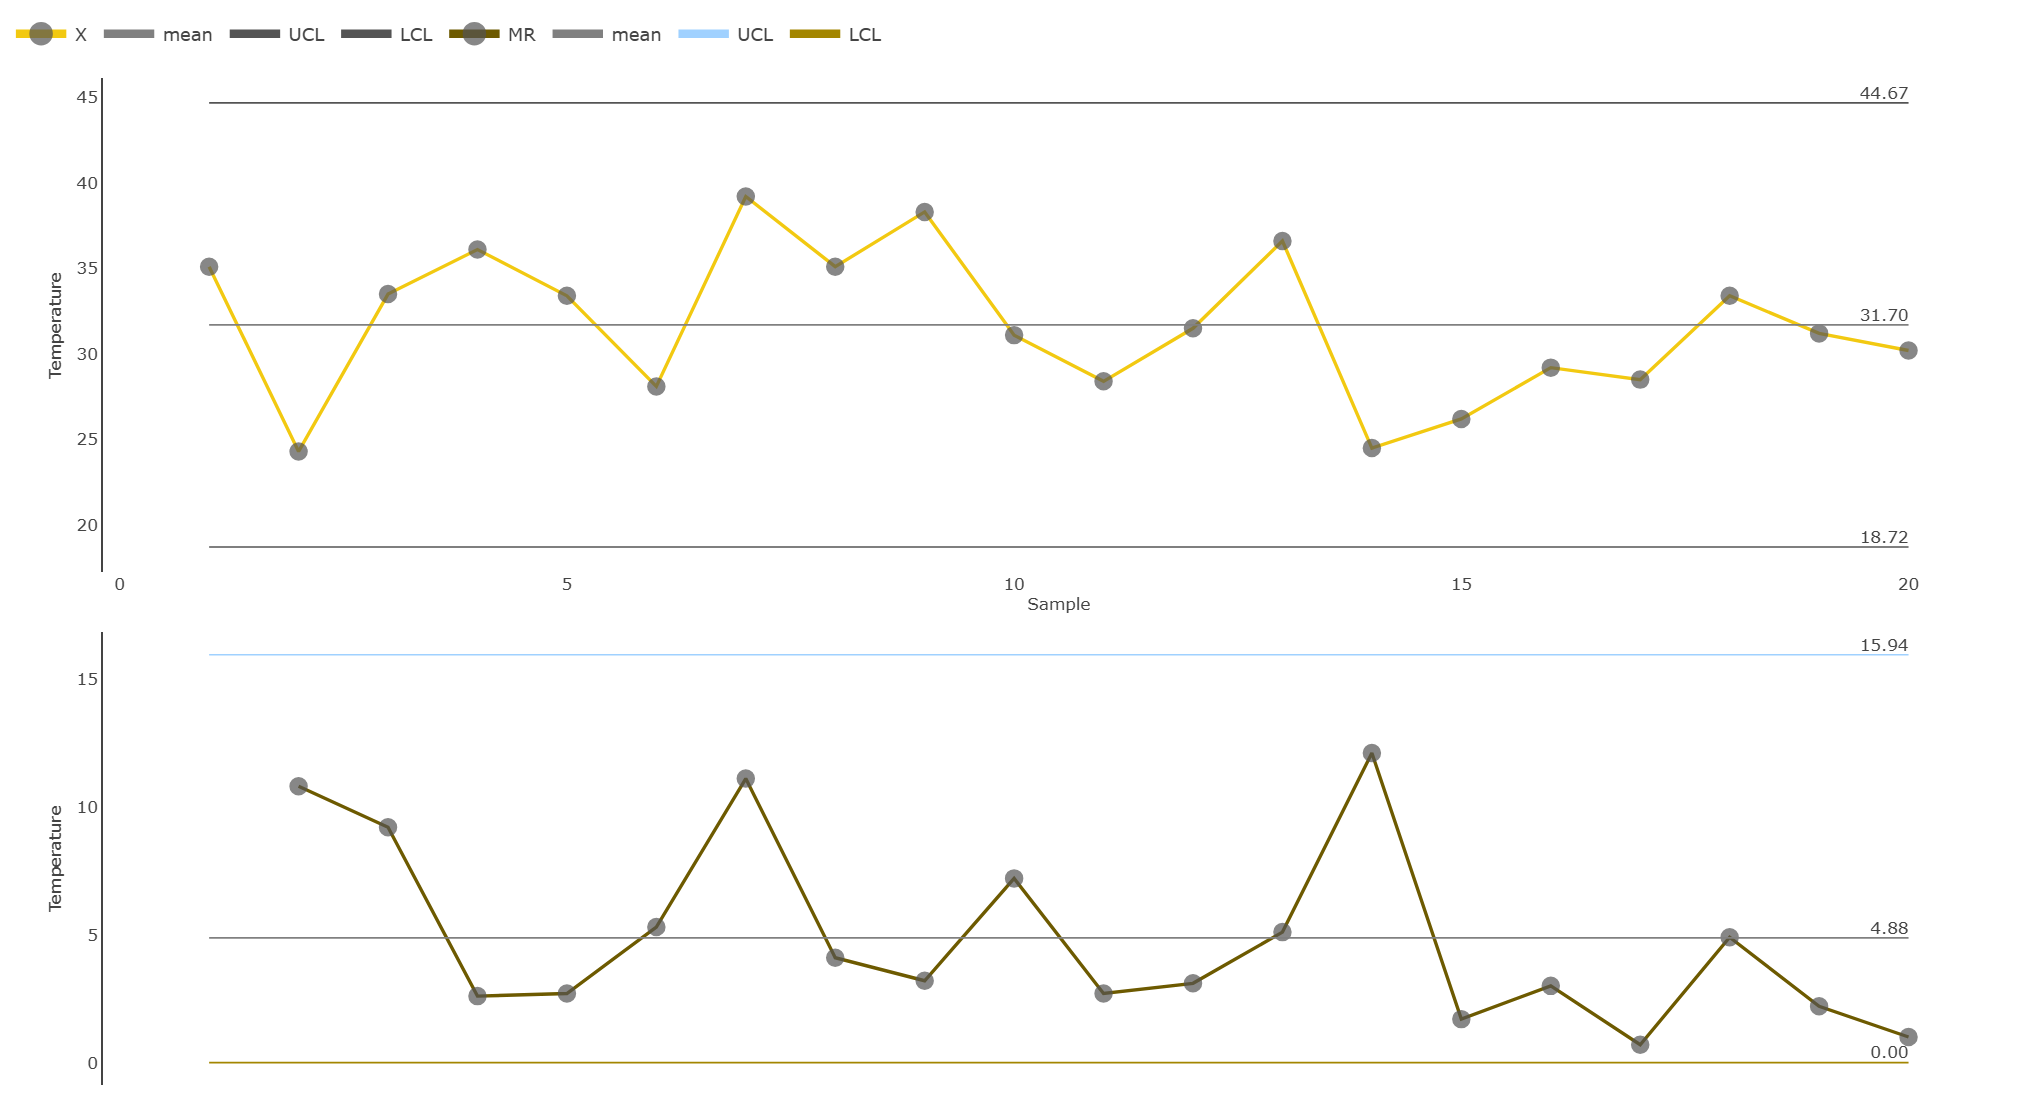
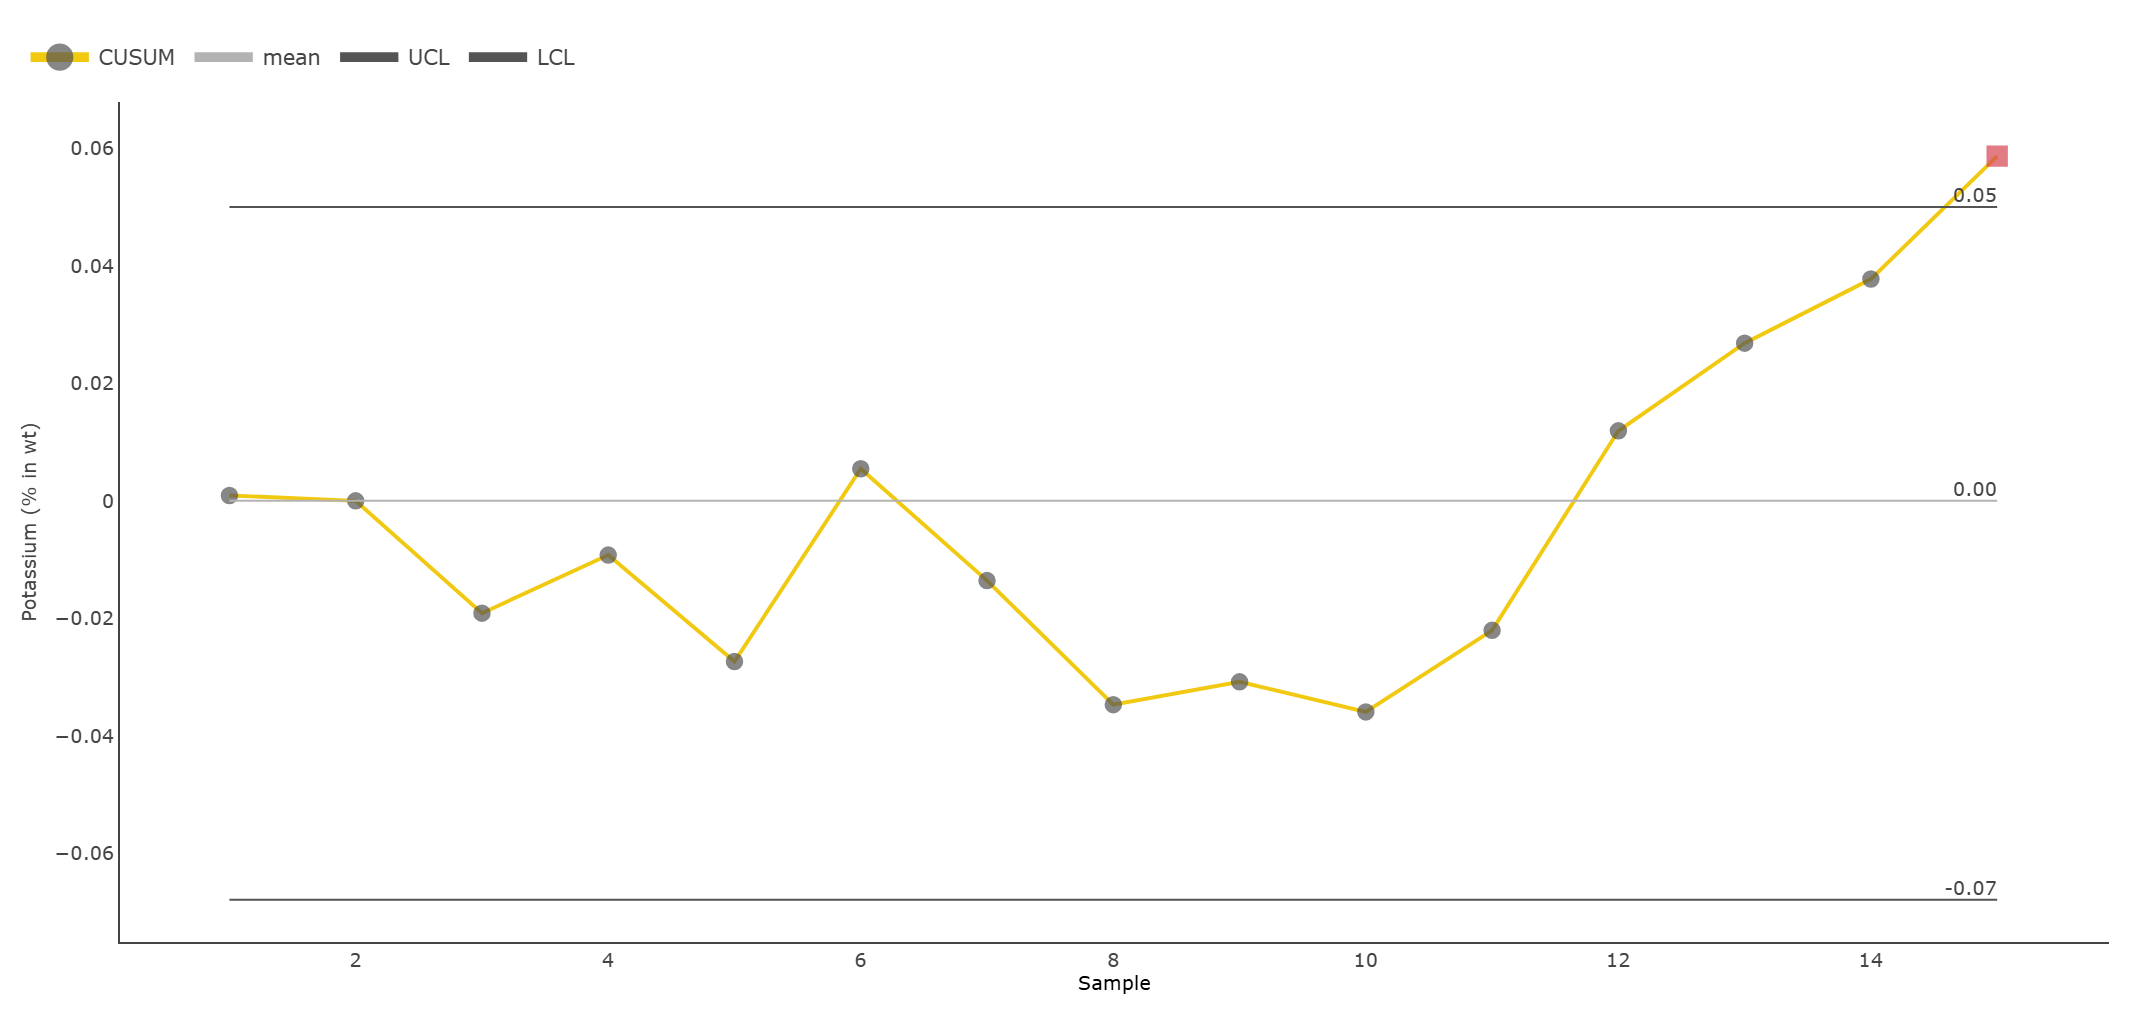
This Power BI custom visual is used to monitor and control quality by tracking categorical (attribute) data, such as defects, errors, or pass/fail outcomes. It helps identify variations, detect trends, and ensure processes remain within control limits, enabling quick decision-making for quality improvement.
Note - This visual is a part of our standard suite.