Visual design
Creating a visual requires these steps:
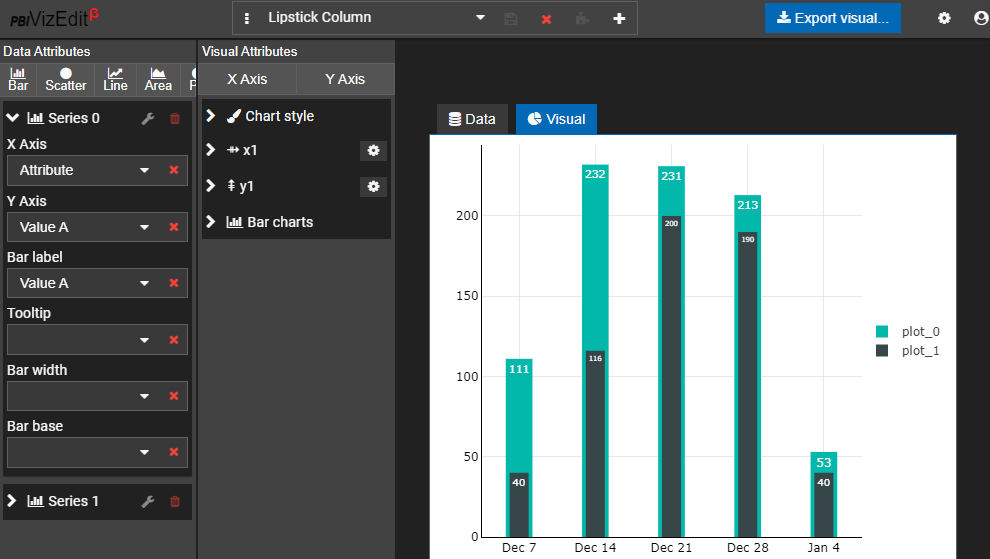
- Import sample data in PBI VizEdit. This is done in the DATA tab in above screenshot. For more information see, Data Import.
- Design your chart. And it requires you to:
- Supply data in Data Attributes pane. See, Data Attributes.
- Change the properties of charts and its individual plots as desired in Visual Attributes pane. See, Visual Attributes.
- Provide Power BI related properties in Export visual dialog. See, Export Visual.