Conditional color formatting through Gradient
Prerequisite:
- Proceed with this page once you have mapped the Color/Legend fields with desired data fields for which you want conditional color formatting.
In case you want further information on prerequisite, click here.
Step 1
Select ‘Gradient’ option from the dropdown menu of format style. It is supported to numeric data field and not to the text field.
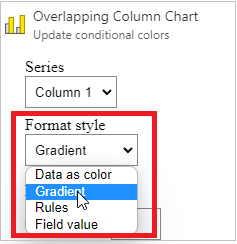
The gradient color formatting is available in two different ways. You can therefore follow Step 2 or Step 3 as per the chart requirements.
Step 2
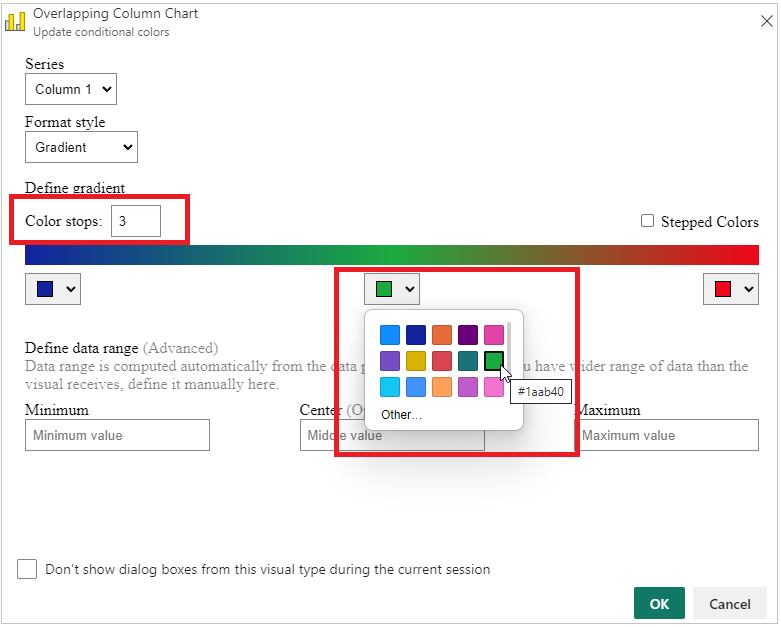
a. Color stops is used to add number of colors to the gradient. It’s value varies from 2 to 10. You can change the color whatever you want in the color bar.
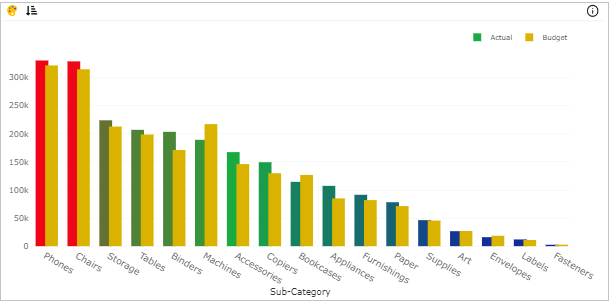
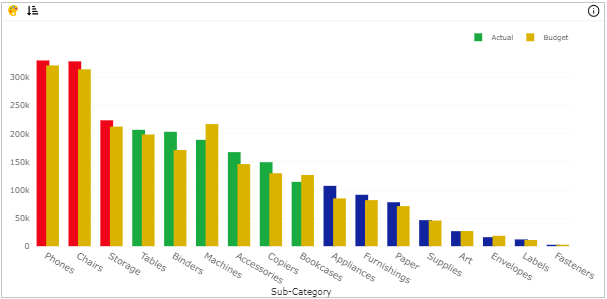
For example, select three colors ‘Blue’, ‘Green’ and ‘Red’, then click OK button to reflect the gradient in the visual as below. The highest bar is ‘Red’, the lowest bar is ‘Blue’, the middle bar (middle value) is ‘Green’ and each bar in between is colored with a shade of the spectrum between chosen colors.
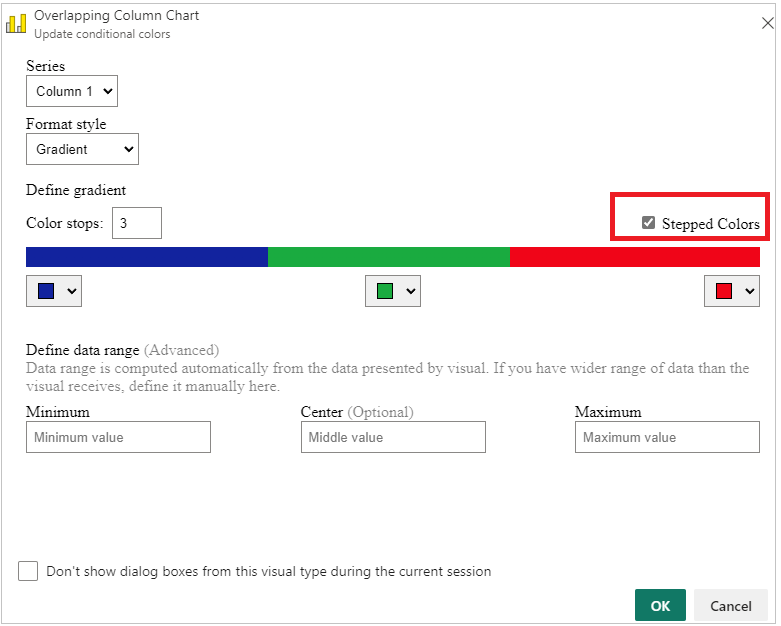
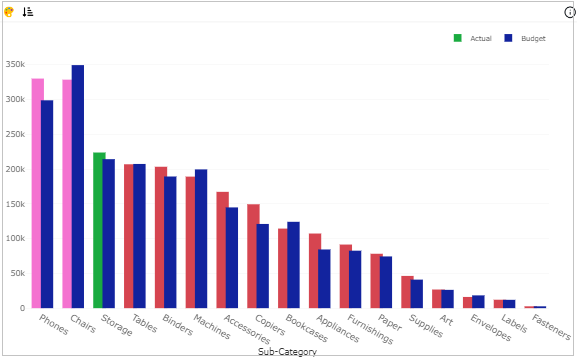
b. If you do not want color shades of the spectrum between the chosen colors, Check the Stepped Colors box to apply exact solid colors in the visual. Click OK button to apply the chosen colors.
Step 3
a. In Step 2, Data range (minimum and maximum value) is computed automatically from the data presented by visual. If you have wider range of data than the visual receives, you can manually enter the minimum, maximum and center value (optional).
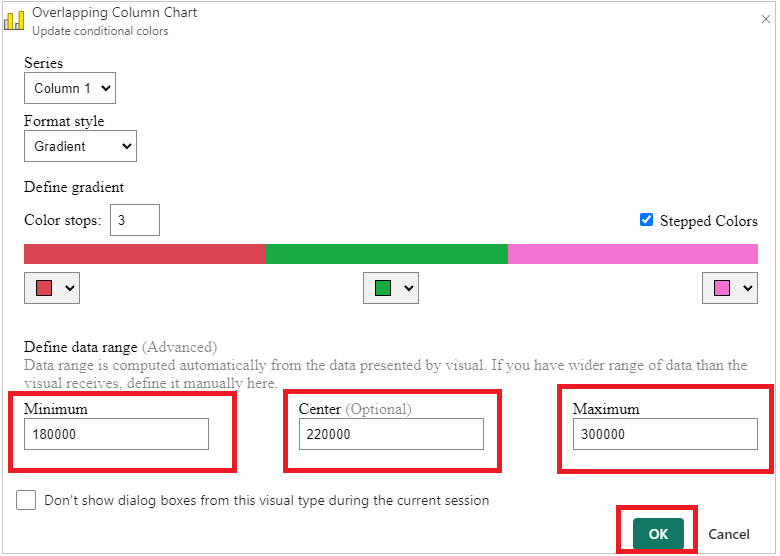
b. Click OK button to see the gradient effect as below.
Note: Gradient is not supported for Pie, Line and Area chart.