Analytics for PBIVizEdit visuals
Step 1
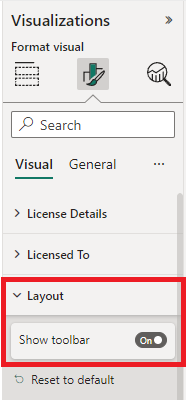
Import PBIVizEdit visual into Power BI desktop/web and make sure ‘Show toolbar’ toggle On in the format pane.
Step 2
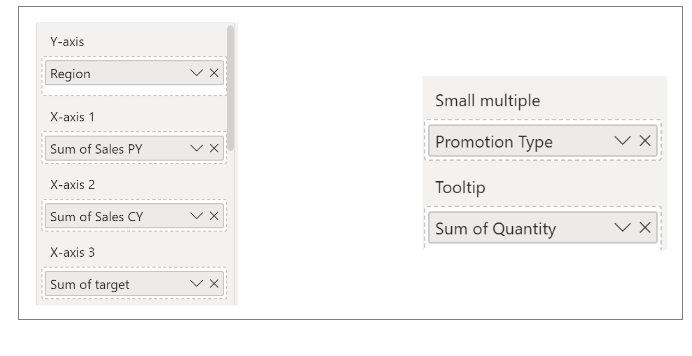
Map your data to respective field to get the analytics formatting. You may map the extra field in the tooltip.
Step 3
Click the analytics icon located at top left of the visual to display the analytics dialog box.

Step 4
PBIVizEdit provides three types of analytics:
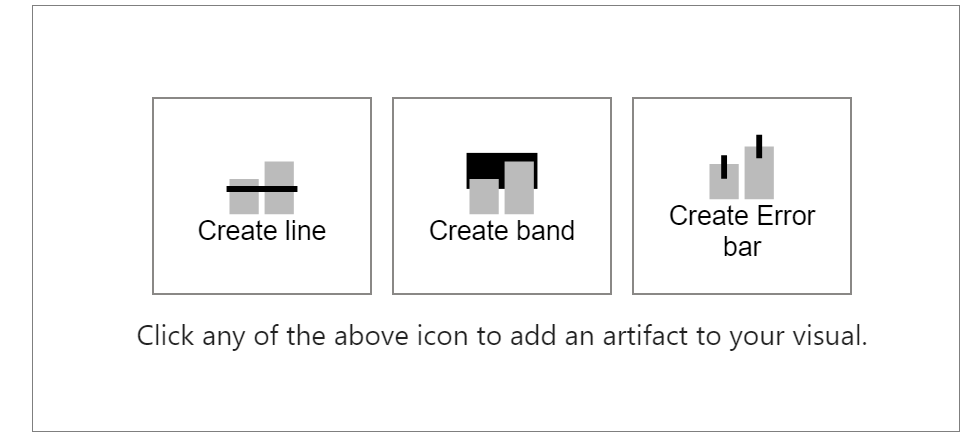
Select (any) one option from the type of artefact which you want to add to your visual. For example, Lipstick Bar Chart has three options: Line, Band and Error bar. If you want to add line to your visual, then accordingly select Create line option.