Conditional color formatting based on Field value
Prerequisite:
- Proceed with this page once you have mapped the Color/Legend fields with desired data fields for which you want conditional color formatting.
In case you want further information on prerequisite, click here.
Step 1
Select ‘Field value’ option from the dropdown menu of format style. This option mainly used to Categorical data values in the chart.
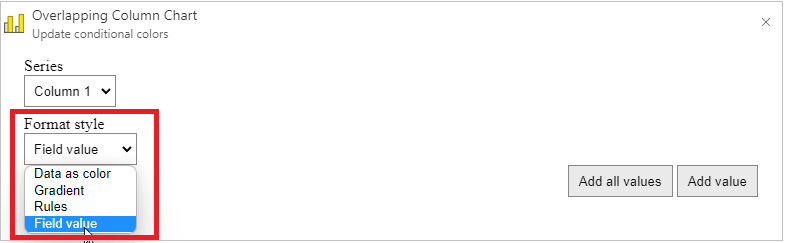
Conditional color formatting is available in two different ways. You can therefore follow Step 2 or Step 3 as per the chart requirements.
Step 2
a. Click ‘Add all values’ button to display all color field data values with Power BI theme colors.
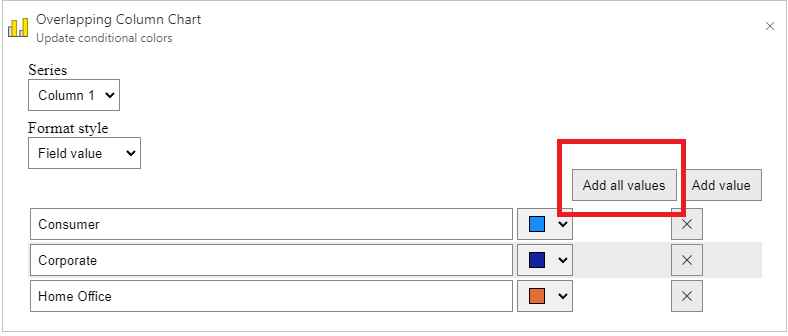
b. Here, you can change and map a desired color from the color palette or you can remove the particular data value from the list by clicking ‘X’ button.

c. Once you map all the colors, Click OK button to apply the conditional colors.

Step 3
a. Click ‘Add value’ button to enter as many data entries as you want, then enter the data value manually and map a color to it as below.
For example, ‘Segment’ column is bounded to Color 1 field. It has ‘Consumer’, ‘Corporate’, ‘Home Office’ data values. Here, ‘Home Office’ data value mapped to 'Green' color, and selected Power BI theme colors applied by default to the remaining data values.
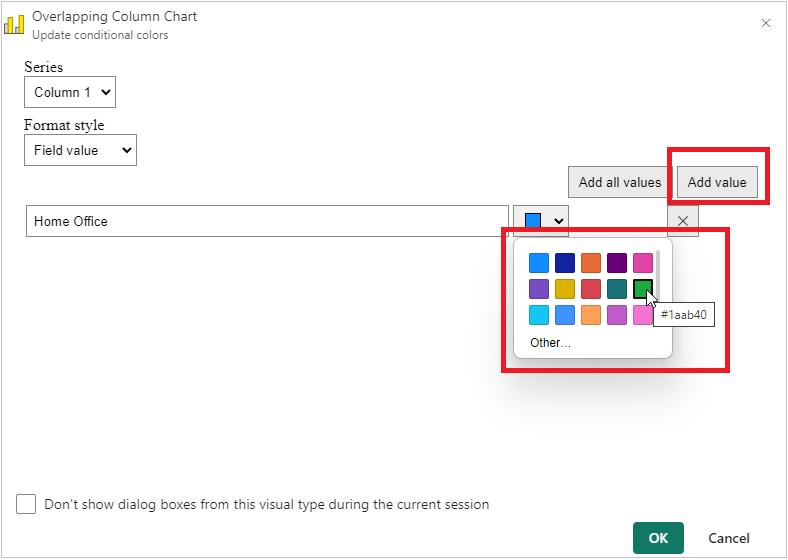
b. Once you map all the colors, Click OK button to apply the conditional colors.
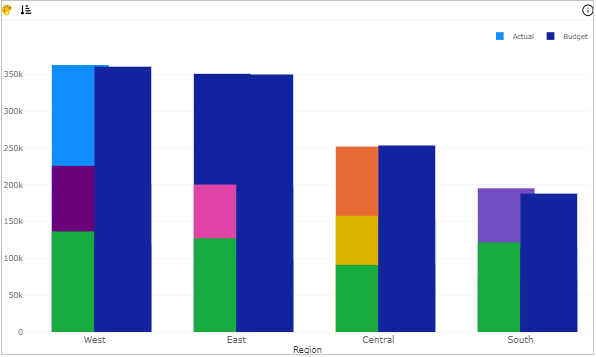
Note: If the data value is not explicitly mapped to any color in the visual, in that case, Power BI theme colors are applied by default.