Chart axis
Different properties of axis and its subsections are described below:
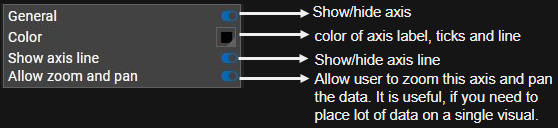
General
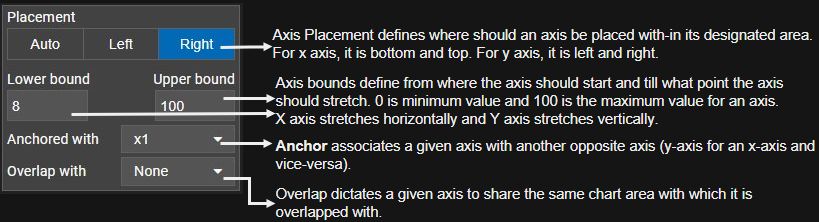
Placement
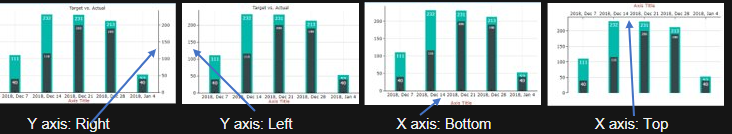
As an example, placement property affects the axis layout like this:
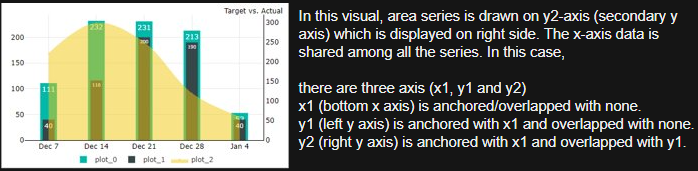
Anchored with and Overlap with properties can be understood with the give example:
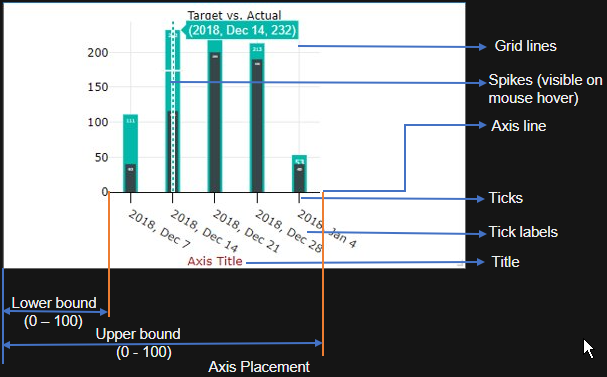
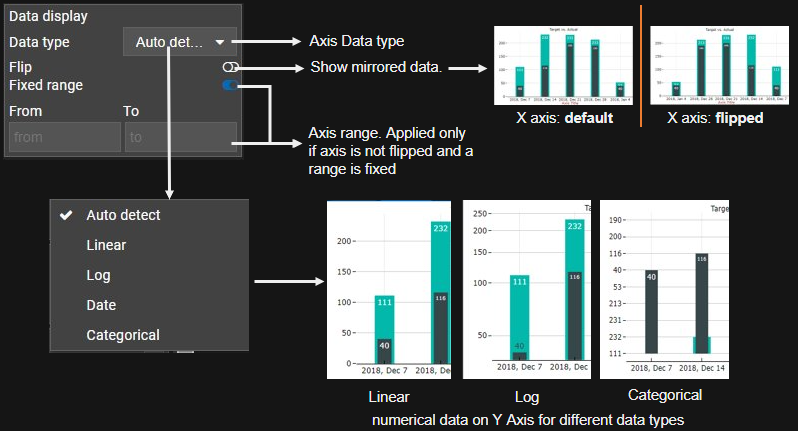
Data display
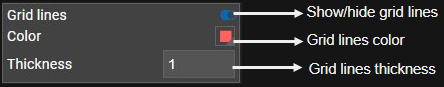
Grid lines
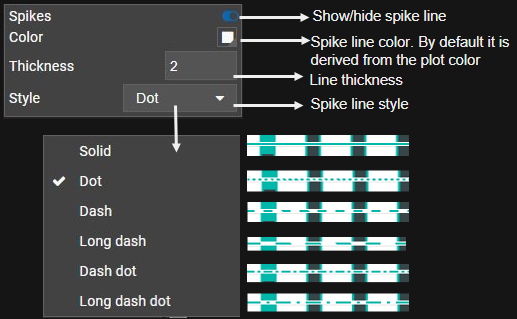
Spikes
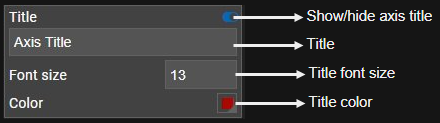
Title
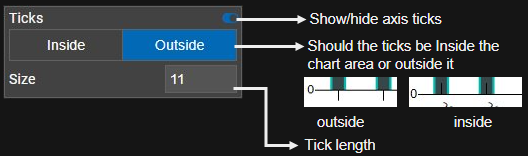
Ticks
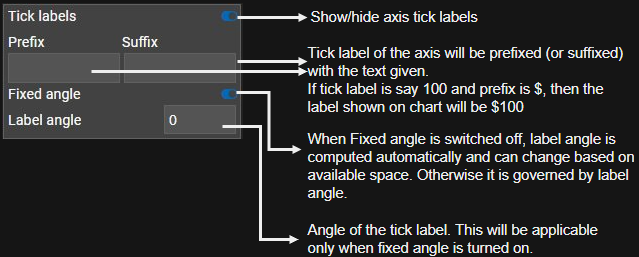
Tick labels
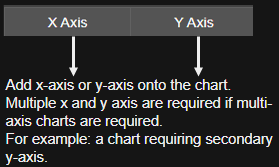
Axis management
Your visual can have any number of cartesian axis (namely x-axis and y-axis) on the chart. These axis can be added by clicking on the following buttons:
You can rename the axis and also remove them on clicking on gear icon shown below:
