Bubble
Change the properties of bubble/scatter under this section.
|
|
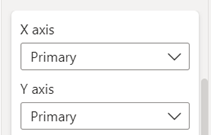
- X axis: Choose on which X axis you want to plot your series. It has two options Primary and Secondary.
- Y axis: Similar to X axis property field, choose whether you want to plot your series on Primary Y axis or Secondary.
Note – These formatting properties are currently available only in our advance visuals like Dual X-axis Combo Chart, Dual Y-axis Combo Chart, Advanced Line Chart and Multiple Vertical Line Charts.
|
Bubble properties
|

|
- Change the color, opacity (transparency) and size of the bubble. Opacity value ranges from 0 to 1, 0 being complete transparent.
- Shape: 20+ options are available to customize the shape of bubble/marker.
- Outline: Enable Show outline only to show only the outline for the marker (closed shape). Can also customize the outline’s thickness and color.
|
Properties related to Data labels
|
|
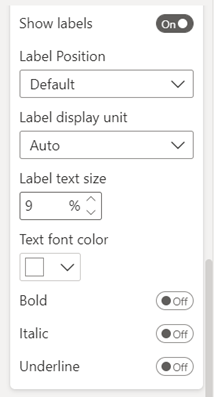
- Show labels: Enable/disable the data labels by toggling the On/Off button.
- Customize the position of data labels, number format, size and color, and make them bold, italicized and/or underlined.
|