Horizontal or Vertical Lines
Prerequisite:
- Open the analytics dialog as described in the analytics page.
Step 1
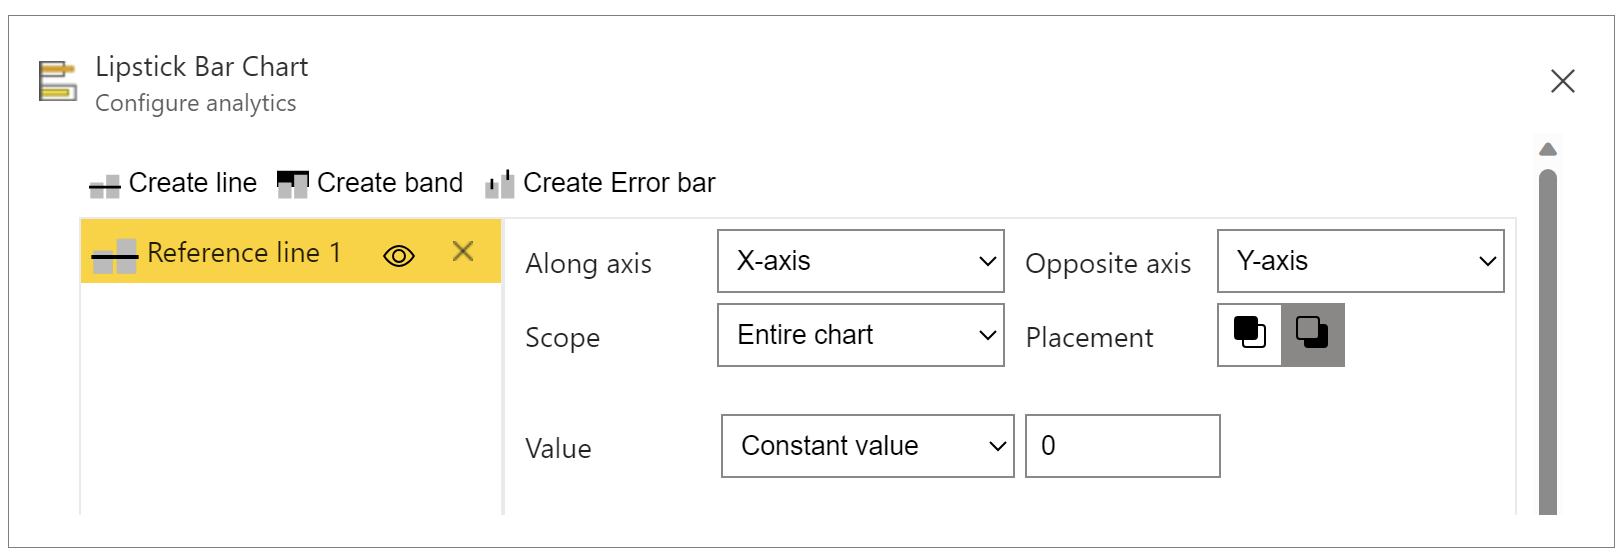
Select the axis along which you want to create line. Opposite axis will automatically get mapped, if there is more than one opposite axis then select accordingly.
Scope: Entire chart or Per tile. Applicable only in the case of small multiple. If you select Per tile, the line created for each small multiple will compute its value according to small multiple data only.
Placement has two options, you can select accordingly whether you want to draw line on top or below of your main chart.
Step 2
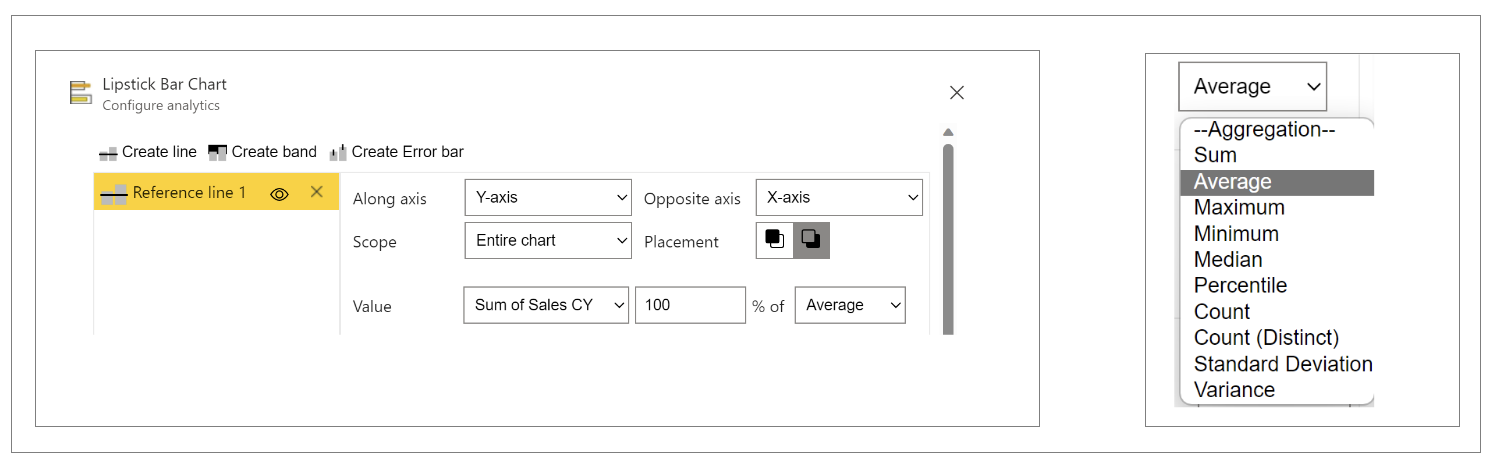
To assign value to a line, we have two options. Either a constant value or an existing data field can be chosen. If data field is chosen, aggregate functions like (Sum, Average, etc.) has to be applied.
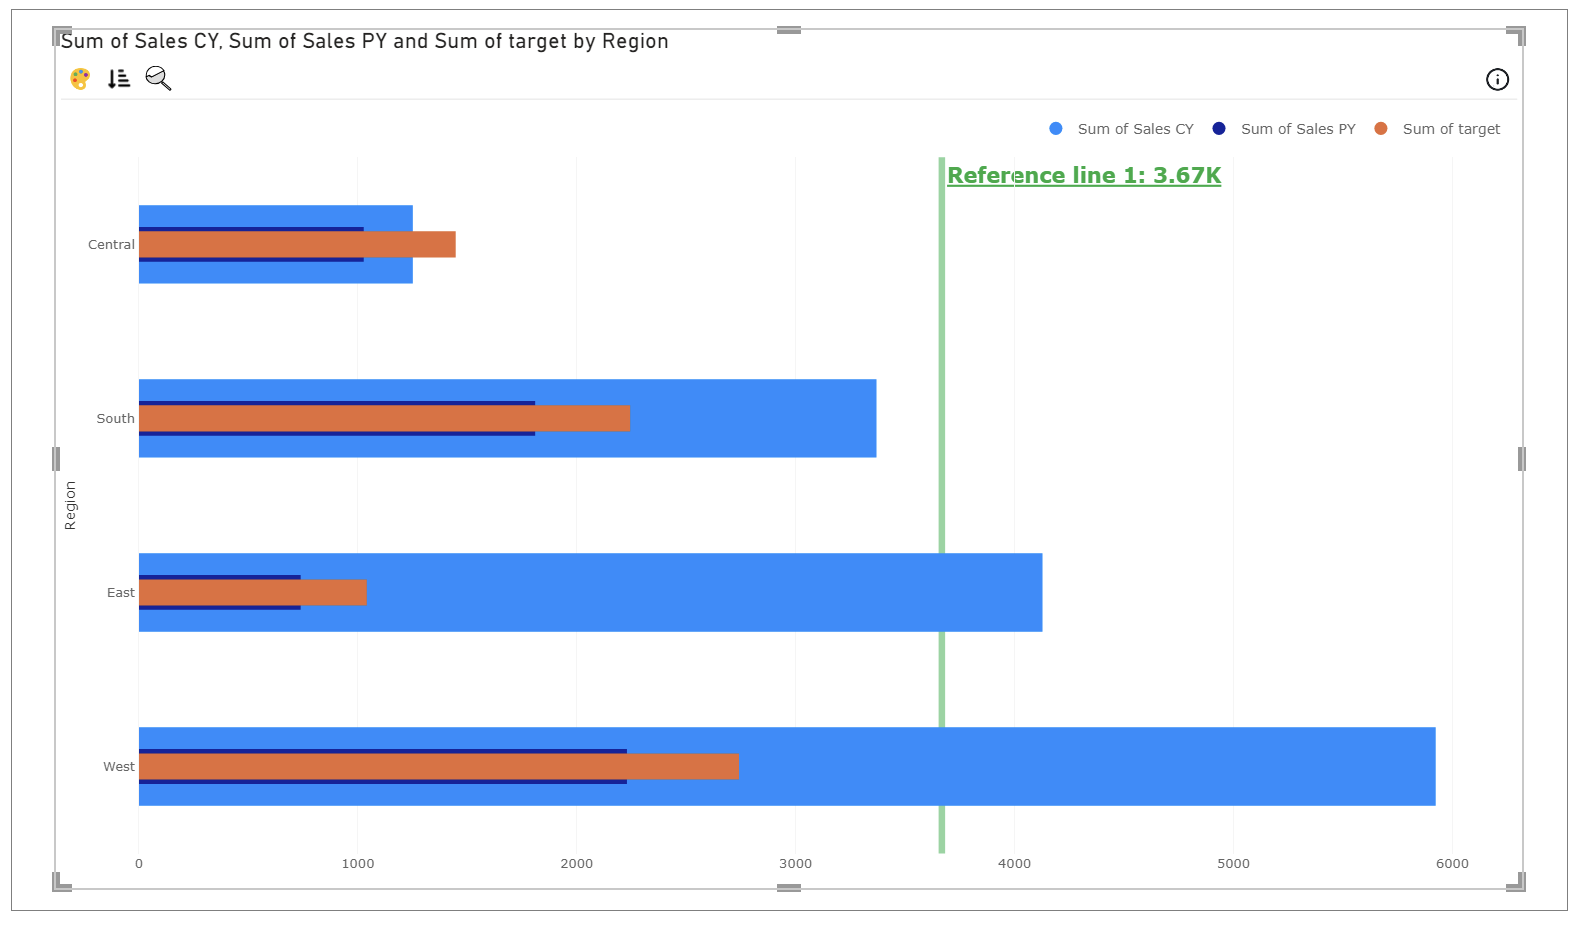
For example, below we have chosen 'Sum of Sales CY' where 100% of its average is taken as value of line.
Step 3
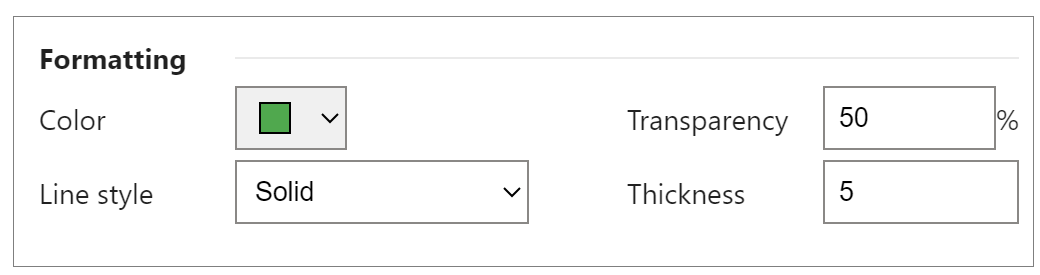
You can customize the properties of line like color, transparency, style and thickness.
Step 4
Line can display label which can be a data value, caption or both.
If data value is numeric, format can be chosen otherwise value format should be auto.
Label alignment, orientation and position with respect to line can be set accordingly.
Label formatting like color, font size and bold/italic/underline can be set.

Click OK button to add the line.