Create Scatter Plot Transparency for Power BI
This visual is created from visual Dual Axis Scatter Plot
Steps to create Scatter Plot Transparency from Dual Axis Scatter Plot
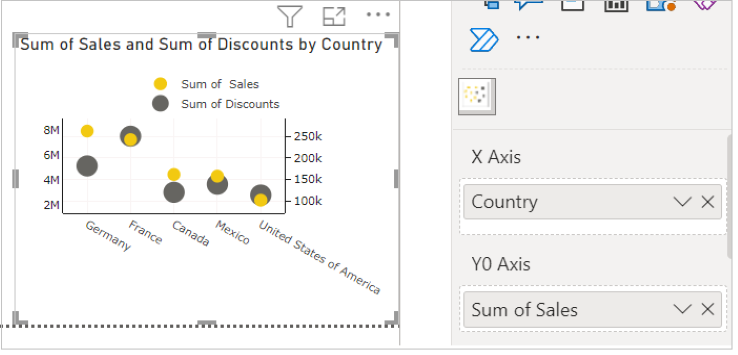
Step 1. Map your data in the fields available
Here ‘Country’ is mapped under X Axis. ‘Sales’ and 'Discounts' are mapped under Y0 Axis and Y1 Axis respectively.
Step 2. Choose the Series Type
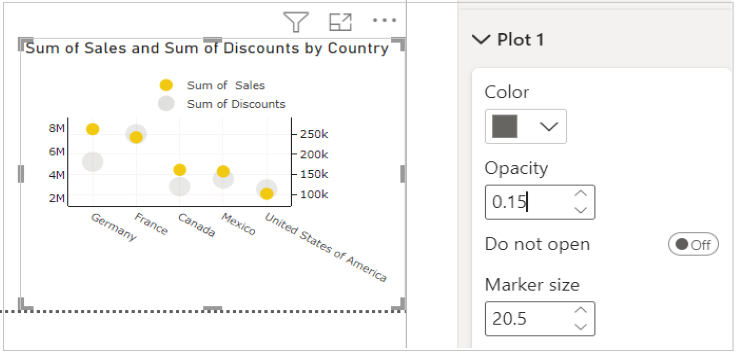
Go to Format Visual tab. Under ‘Plot 1’ section reduce the Opacity value to make the scatter plot transparent for value mapped under Y1 Axis
Similarly, you can make scatter plot transparent for the value mapped in Y0 Axis, by changing Opacity value under 'Plot 0'.