Create Dual Y Axis Line Chart for Power BI
This visual is created from advance visual Advanced Line Chart
Steps to create Dual Y Axis Line Chart from Advanced Line Chart
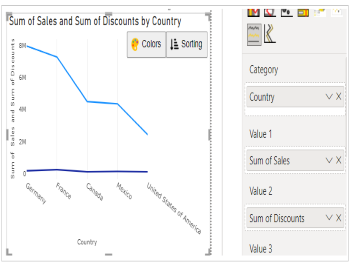
Step 1. Map your data in the fields available
Here ‘Country’ is mapped under Category. ‘Sales’ and 'Discounts' are mapped under Value 1 and Value 2 respectively.
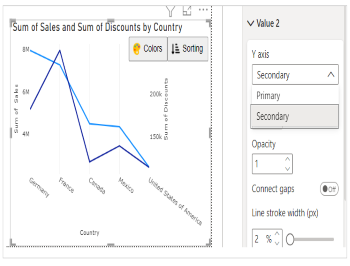
Step 2. Select the Axis Type
Go to Format Visual tab. Under ‘Value 2’ section, select Secondary in Y axis.
e.g. - Here for Sales, we have selected Primary for Y axis and for Discounts, we have selected Secondary for Y axis
Step 3. Format your visual further
You can further format your visual like color, size, opacity of your series, labels, legend etc under the same tab ‘Format Visual’.
