Tutorials
This section describes hands on tutorials to create various types of charts in PBI VizEdit tool.
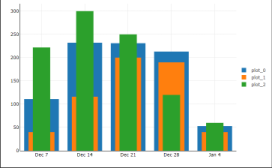
Nested Bars
This tutorial explains how to use bars and generate a Power BI visual. In this visual, we are going to create 3 nested bars (also known as lipstick charts):
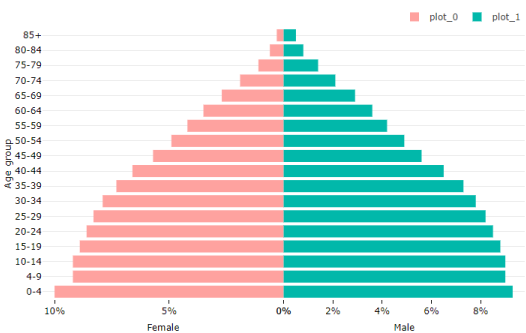
Population Pyramid
This tutorial explains how to use multiple axis in a single Power BI visual. This visual draws a divergent bar graph representing male and female population against age group: