Color axis
This section is used for formatting the properties of the Color axis. Toggle to show or hide the color axis.
|
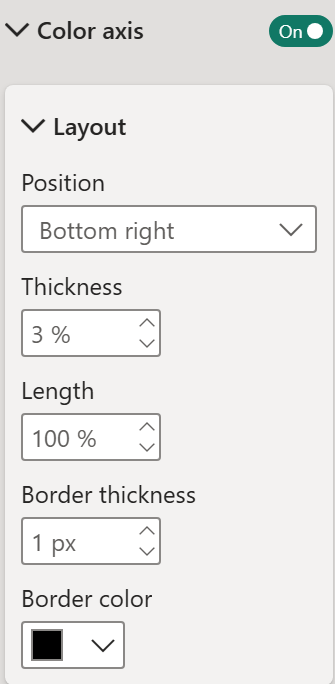
- Layout: Customize the appearance and positioning of the color axis with the following options:
- Position: Choose the position of the color axis (e.g. Bottom right, Top left, etc.)
- Thickness: Set the thickness of the color axis as percentage (e.g. 3%) of visual area.
- Length: Define the length of the color axis as a percentage (e.g. 100%) of visual area.
- Border thickness: Set the thickness of the border around the color axis (e.g. 1 px)
- Border color: Choose the color of the border around the color axis.
|
|
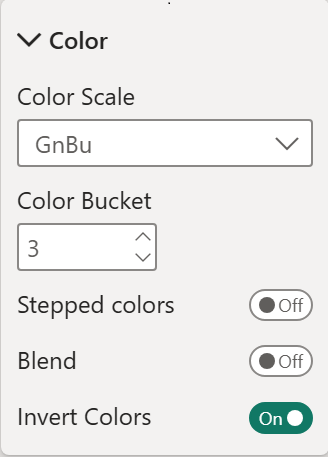
- Color Scale: Select the color scale to be used for the color axis (e.g., Single colors like Blues, Greens or Combinational colors like GnBu, etc.)
- Color Bucket: Each color scale comes with predefined from 3 to 8 buckets. Set the number of color buckets/segments for the color scale.
- Stepped colors: If you want your data to take all colors of color scale, toggle it off. Enable when you want only discrete colors to be taken instead of continuous gradient.
- Blend: Toggle to enable or disable color blending on the visual.
- Invert Colors: Toggle to invert the color scale order.
|
|
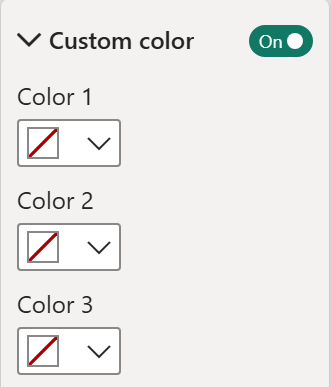
- Custom color: Toggle to enable custom colors to define the color scale instead of predefined color scales. You need to choose at least two colors.
- You can set up to nine custom colors for the color scale using the color pickers.
|
|
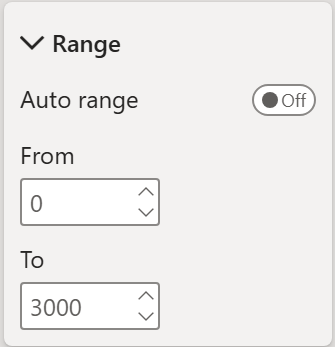
- Auto range: Switching it ‘Off, allows to define the axis range manually. When On, Colors are applied based on value, first color takes the From value and last color takes To value on data. Any data point beyond this range will assume the last color defined by Color Scale on any end.
|
|
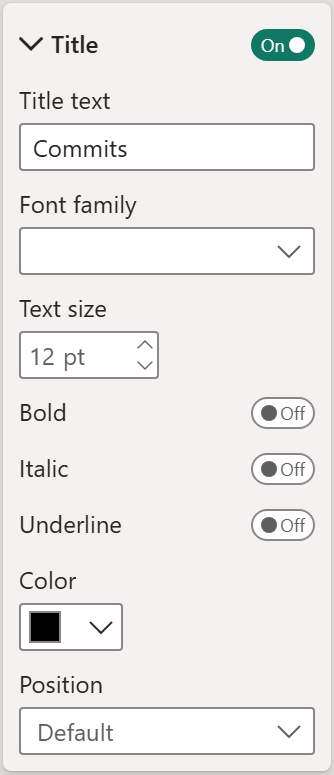
Properties available under Axis Title section are related to title of the Color axis:
- Title: Enable or disable the title and change its properties for the axis.
- You can change the color axis title text, size, color and the style (bold, italics and/or underline).
- You can change the position of the title with respect to Color axis.
|
|
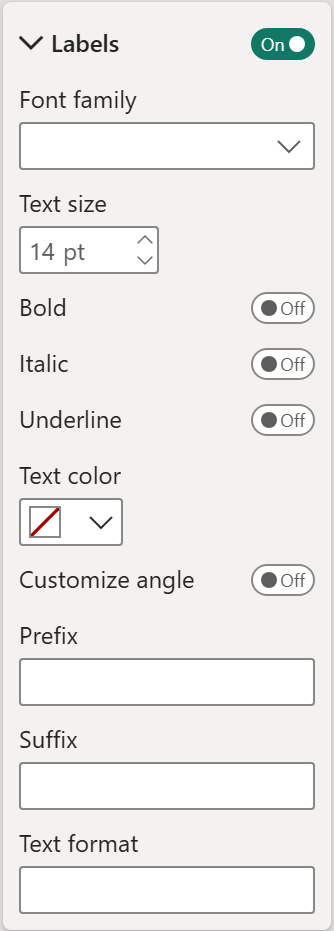
Properties available under Labels section are related to Color axis labels:
Labels: Change the color axis labels’ font, size, style (Bold, Italic and/or Underline), color, angle.
Color axis labels can be removed from the visual by toggling off ‘Labels’.
- Prefix: Text written here will be added before the axis labels.
- Suffix: Text here will be added after the axis labels.
- Text format: Format the axis labels using D3 format.
|
|
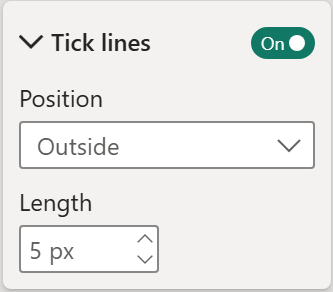
Properties available under Tick lines section:
- Tick lines: Enable or disable the tick marks on the axis by toggling the On/Off button.
Change the Tick line position. Choose Inside to draw the tick marks inside the color axis and Outside to draw the marks outward.
- Change the tick length according to the need. The value ranges from 1 to 20.
|